Measuring financial inclusion: A comparative analysis of regional South Africa
Introduction: why measuring financial inclusion matters
Past measurements of financial inclusion models have not produced the detailed results that policymakers may find useful.[1] There was thus a need for research of a more quantitative nature to measure the status of financial inclusion. Past research has used surveys to measure inclusion, but the method has not been precise.[2] This research, on the other hand, constructs a quantitative index and includes two dimensions from the financial sector. The dimensions included four variables associated with data available from formal financial institutions. The variables are adjusted for geographical penetration indicators to account for the scale in which banks provide their products and services.[3] Hence bank ATMs, branches, deposits, and borrowing data by people above the age of 15 are the focal variables that make up the indices that are then aggregated into a composite index.
These variables are:
- The number of Automated Teller Machines (ATMs)
- The number of branches.[4] Financial intermediaries, excluding the central bank, offer depository services, credit, and cash collection points in the form of ATMs and branches.
- The number of resident household depositors; and
- The number of resident household borrowers.[5] Household depositors refers to households with at least one deposit account, and household borrowers refers to households with at least one loan account at a financial institution.
There is consensus between industry, researchers, and community organizations that dynamic access and usage of financial services promotes sustainable local economic growth, employment, general well-being, and financial stability.[6] Until now measurements of financial inclusion have been limited and have provided a view at a national level only. The data have been collected from Statistics South Africa (StatsSA) and the South African Reserve Bank (SARB).
Financial inclusion in South Africa is sensitive to adverse economic shocks. Hence, studying and measuring financial inclusion at a regional level is important because policymakers can identify regions that require intervention. There is a positive correlation between densely populated, high-income provinces and financial inclusion indicators. But the indices also show that regional level financial inclusion is possible regardless of the provincial income share and population magnitudes.
Making financial services available to the excluded portion of the population mitigates poverty, improves financial wellbeing, reduces barriers to finance, and enables access to credit and to savings for unforeseen circumstances. An inclusive financial environment can facilitate financial development and reduce income inequality. Access to financial products and services has a positive impact on consumption smoothing – balancing spending between today’s needs and saving for the future. The financially included are better at making consumption, saving and investment decisions than those who are excluded. They are also more resilient to socio-economic shocks.
South Africa is one of the most unequal countries in the world and regional financial inclusion indicators reflect this.
Findings
This study computed the financial inclusion index for the period 2009 to 2018. The analysis makes reference to provincial income groups, adult population, and geography. We analyze two dimensions: access and usage in all nine provinces.[7]
Access to formal financial services
At a national level, the number of ATMs per 1000 km2 increased by 57% from 14 to 22 between 2009 and 2018. However, high-income and densely populated provinces have a large number of ATMs per 1000 km2. This means that individuals in regions that have a high share of incomes have greater propensities to earn, receive, spend, invest, and save money. At a provincial level, the number of ATMs increased from 2.97 to 4.55 per 1000 km2 in Gauteng, from 2.23 to 3.41 in Western Cape, 0.74 to 1.14 in Northern Cape, 1.04 to 1.59 in Eastern Cape, 2.23 to 3.41 in Free State, 0.89 to 1.37 in North-West, 2.08 to 3.19 in Kwazulu-Natal, 1.49 to 2.28 in Mpumalanga, and 1.19 to 1.82 in Limpopo.
In the sample period, as population size grew so did the number of ATMs in Gauteng, Western Cape, Eastern Cape, Limpopo, and Mpumalanga. The other provinces, with lower populations, have a lower ATM concentration.
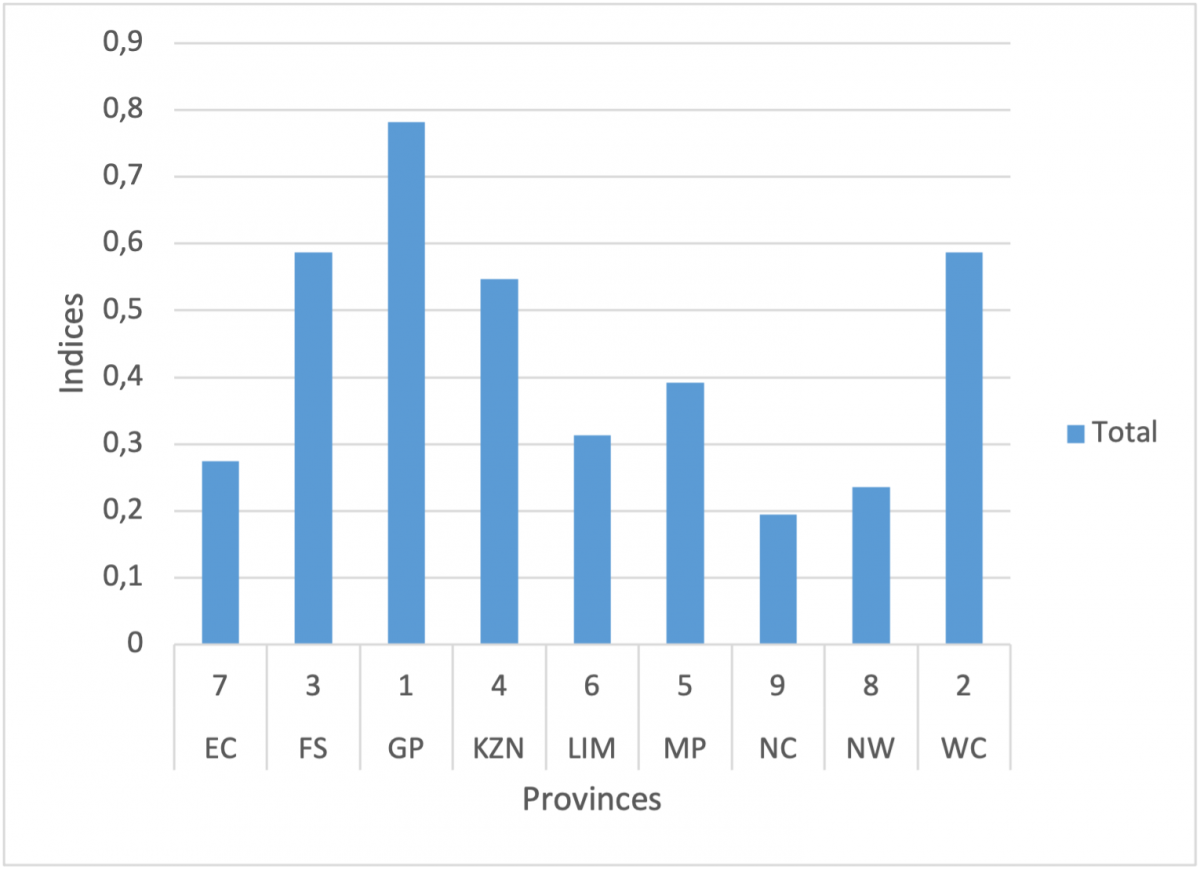
Targeting provinces that contribute a lower percentage to the national GDP with financial services may reduce the divergence between low- and high-income provinces. A good case is that of the Free State, which ranks third in ATMs but eighth in GDP contributions out of nine provinces. Figure 1 shows the provincial ranking with respect to access to ATMs as an average of the indices from 2009-2018.
Figure 1: Provincial ranking - Access to ATMs
Source: Author's own calculations
Between 2009-2018 the number of bank branches per 1000 km2 increased from 0.53 to 0.70 in Gauteng, 0.40 to 0.52 in Western Cape, 0.13 to 0.17 in Northern Cape, 0.19 to 0.24 in Eastern Cape, 0.40 to 0.52 in Free-State, 0.16 to 0.21 in North-West, 0.21 to 0.28 in Limpopo, 0.37 to 0.49 in Kwazulu-Natal, 0.26 to 0.35 in Mpumalanga. On a national level the number of branches increased from 2.6 to 3.5 per 1000 km2. The number of branches is also associated with a share of GDP for each province and the size of the adult population. Provinces with more ATMs also have a greater number of branches of financial institutions.
High-income provinces tend to offer better financial services. Figure 2 shows the provincial ranking with respect to access to financial institutions’ branches as an average of indices from 2009-2018.
Figure 2: Provincial ranking - Access to branches

Source: Author's own calculations
Usage of formal financial services
The usage of financial services by individuals within 1000 km2 of each province has some interesting findings. Provinces with high levels of savings score high in money deposits regardless of their GDP share to the whole economy. The number of people aged 15 and up borrowing from formal financial institutions has increased in all provinces. Between 2009 and 2018 the number increased from 130 936 to 169 503 in Gauteng, 45 441 to 69 026 in Western Cape, 21 431 to 82 103 in Free-State, 22 410 to 27 565 in Eastern Cape, 21 192 to 31 485 in Limpopo, 10 441 to 20 438 in North-West, 2882 to 8734 in Northern Cape, 70 879 to 90 979 in Kwazulu-Natal, and 19 631 to 28 696 in Mpumalanga.
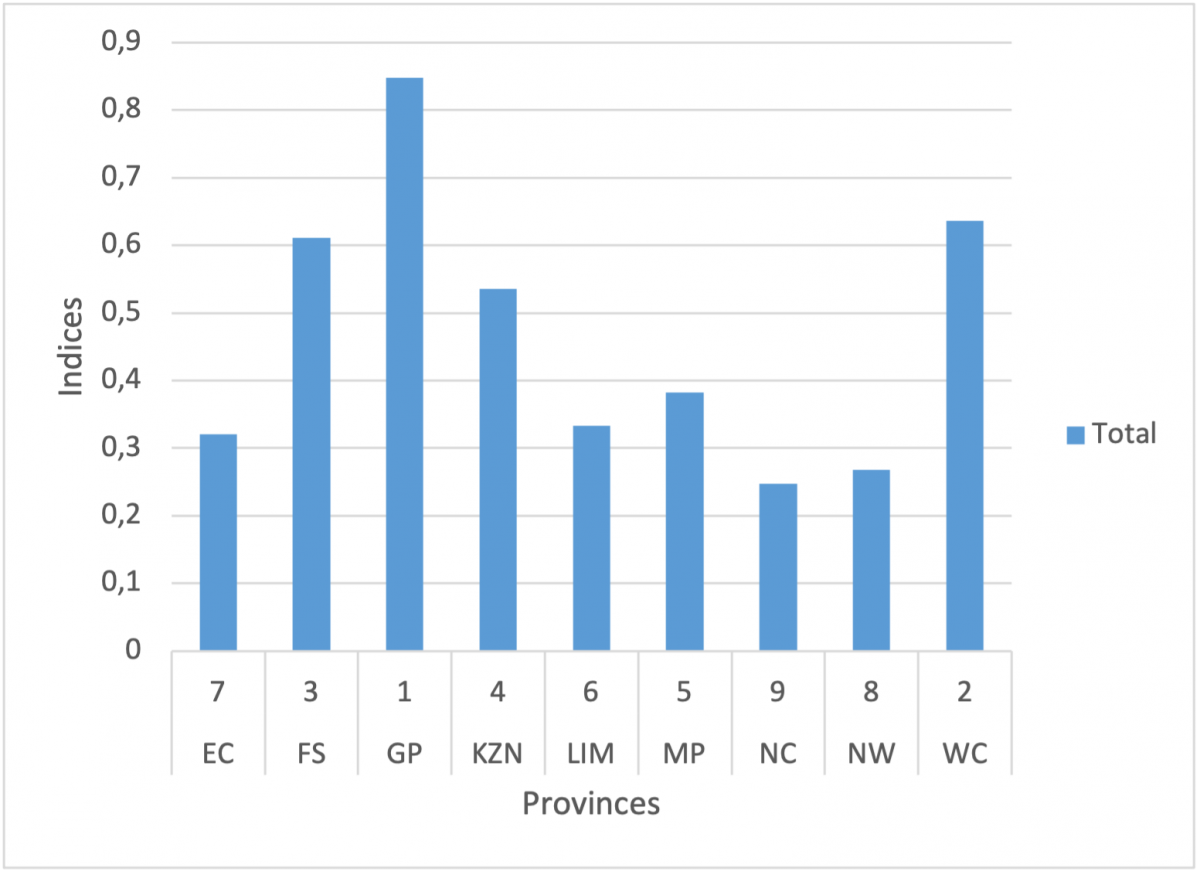
Mpumalanga is a middle-income province and yet ranked highly in deposit taking. Northern Cape is a lower-income province and also ranked highly in deposit taking. Yet high-income provinces, namely, Gauteng and Kwazulu-Natal, have performed rather poorly in deposit taking. Middle-income provinces, namely, Limpopo and Eastern Cape have a lower level of deposit taking compared with lower-income provinces, namely, Northern Cape and Free-State. The Western Cape, a high-income province, leads nationally in savings and has a strong growth in deposit taking. Figure 3 shows the provincial ranking with respect to deposit-taking activities at financial institutions as an average of indices from 2009-2018.
Figure 3: Provincial ranking - Usage by depositors
Source: Author's own calculations
During the sample period, the numbers of depositors per 1000 adults increased from 684 to 1517 in Gauteng, 1106 to 2103 in Western Cape, 485 to 1148 in Eastern Cape, 679 to 1311 in Limpopo, 10 441 to 20 438 in North-West, 1956 to 1861 in Northern Cape, 620 to 1392 in Kwazulu-Natal, and 1149 to 2241 in Mpumalanga. The number of depositors decreased from 2346 to 1768 in Free-State. These statistics reflect that some of the adults have more than one bank account or are banking with more than one formal financial institution.
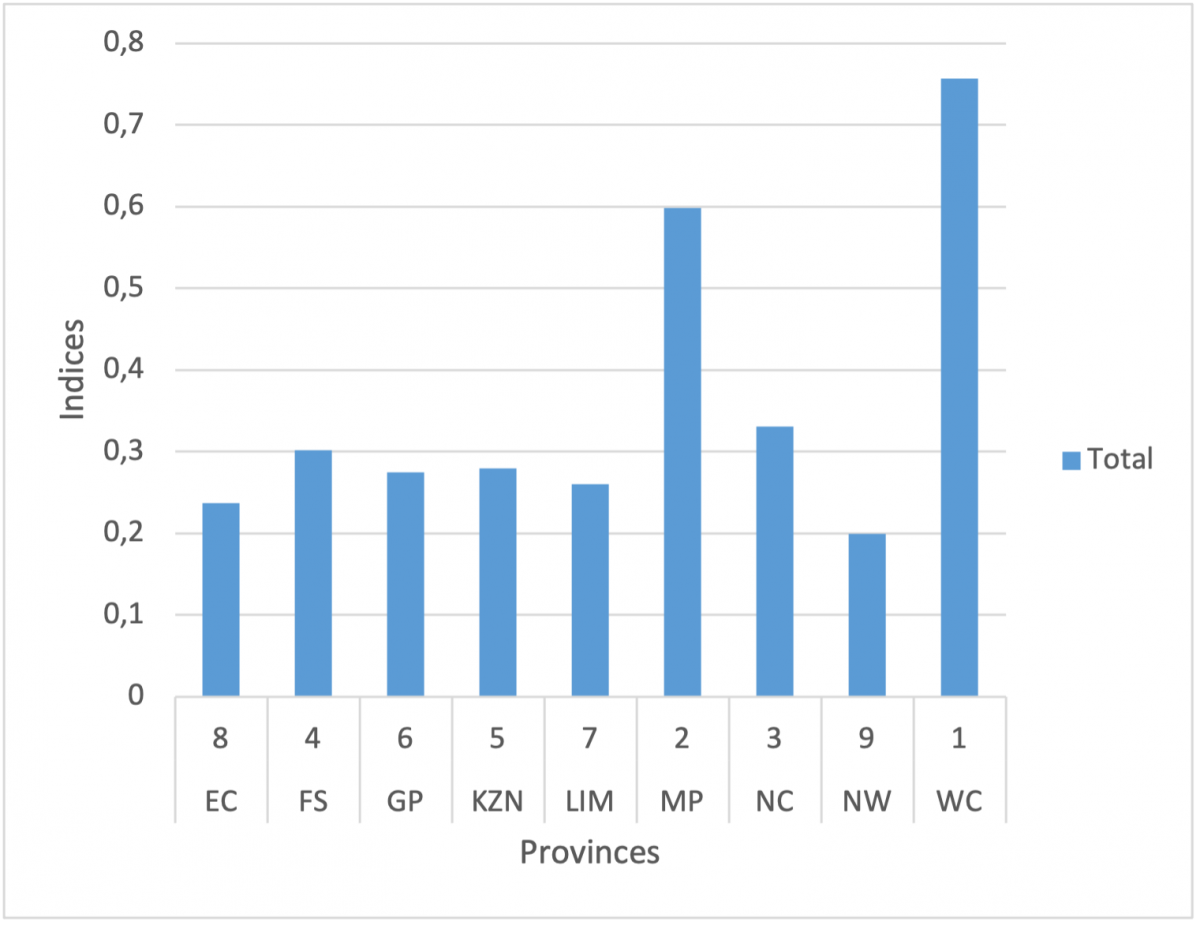
The borrowing behaviour at financial institutions is polarized as high-income and densely populated provinces possess a high level of credit extension. The rate of borrowing is correlated with the access variables of ATMs and branches. Gauteng, the largest economic hub of South Africa, has a dominant position in credit extension. Free-State is a lower-income province but ranks second in borrowing. This is an indicator that individuals in this province could be heavily indebted. Figure 4 shows the provincial ranking with respect to borrowing activities at financial institutions as an average of indices from 2009-2018.
Figure 4: Provincial ranking - Usage by borrowers
Source: Author's own calculations
The composite index
The access and usage dimensions of financial inclusion are combined to produce a composite index used to rank provinces. The index ranks provinces from the most inclusive to the least inclusive in terms of financial inclusion.
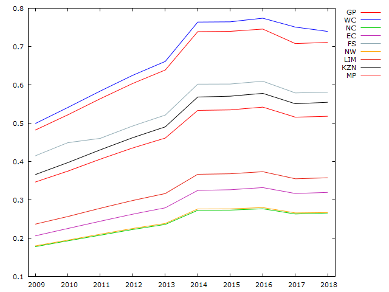
Figure 5: Provincial financial inclusion indices
Source: Author's own calculations
Provinces that have fallen in their ranking since 2009 are the Free State and the Northern Cape. Gauteng, Western Cape, and the Eastern Cape have risen. Limpopo, KwaZulu-Natal, North-West, and Mpumalanga were stagnant. The level of financial inclusion increased steadily in all provinces between 2009 and 2014 and then started falling gradually till 2018. The financial inclusion index for 2018 is lower than the index of 2014, showing there has been a decrease every year in these four years. Between 2013 and 2015, GDP fell sharply and economic growth rates remained below one percent until 2018. Since provincial GDP levels are associated with the volume capacity of ATMs, branches, and borrowers, which dominates the weight of composite index, it indicates that economic activity affects financial inclusion. Figure 5 shows the financial inclusion composite index trends for the nine provinces of South Africa from 2009-2018. Table 1 below shows the overall ranking of the provinces.
Table 1: Financial inclusion provincial ranking
|
Frequency: Annual |
Provinces |
||||||||
|
Year |
GP |
WC |
NC |
EC |
FS |
NW |
LIM |
KZN |
MP |
|
2009 |
2 |
3 |
7 |
9 |
1 |
8 |
6 |
4 |
5 |
|
2010 |
2 |
3 |
7 |
8 |
1 |
9 |
6 |
5 |
4 |
|
2011 |
2 |
3 |
8 |
7 |
1 |
9 |
6 |
4 |
5 |
|
2012 |
1 |
3 |
8 |
7 |
2 |
9 |
6 |
4 |
5 |
|
2013 |
1 |
3 |
8 |
7 |
2 |
9 |
6 |
4 |
5 |
|
2014 |
1 |
3 |
9 |
7 |
2 |
8 |
6 |
4 |
5 |
|
2015 |
1 |
3 |
9 |
7 |
2 |
8 |
6 |
4 |
5 |
|
2016 |
1 |
2 |
9 |
7 |
3 |
8 |
6 |
4 |
5 |
|
2017 |
1 |
2 |
9 |
7 |
3 |
8 |
6 |
4 |
5 |
|
2018 |
1 |
2 |
9 |
7 |
3 |
8 |
6 |
4 |
5 |
Source: own calculations
Policy implications
It is important to understand the association that composite indicators have with economic performance and policies. This is the first time a quantitative financial inclusion measure is being made available at a provincial level in South Africa. This financial inclusion index can be used to guide policymakers to create an enabling environment for financial institutions to reach individuals and create innovative financial products. An enabling environment for financial inclusion should mean lowering costs of financial services, reducing poverty, investing in public and private financial infrastructure, and enhancing financial literacy programs. Private and public-sector partnerships can focus on developing the financial infrastructure of lower- and middle-income provinces. In addition, policymakers have the ability to collect regional demand-side quantitative data for official statistics.
Conclusion
The key goal of this study is to produce the first quantitative measure of financial inclusion for regional South Africa. The constructed composite indicator shows that financial inclusion has increased steadily since 2009. However, barriers to the financial markets are still prevalent. Those excluded, especially the poor, are becoming more marginalized. The digital divide is a major problem worsening financial exclusion. Even people who can afford to access and make use of financial products and services, do so at high cost. Building financial capacity in all provinces is important to promote inclusive economic growth.
References
Anarfo, Ebenezer Bugri, Joshua Yindenaba Abor, Kofi Achampong Osei, and Agyapomaa Gyeke-Dako. “Financial Inclusion and Financial Sector Development in Sub-Saharan Africa: A Panel VAR Approach.” International Journal of Managerial Finance 15, no. 4 (August 5, 2019): 444–63. https://doi.org/10.1108/IJMF-07-2018-0205.
Angela C. Lyons & Josephine Kass-Hanna (2019). Financial Inclusion, Financial Literacy and Economically Vulnerable Populations in the Middle East and North Africa, Emerging Markets Finance and Trade, DOI: 10.1080/1540496X.2019.1598370
Sarma, Mandira, and Jesim Pais. “Financial Inclusion and Development”, Journal of International Development 23, no. 5 (July 2011): 613–28. https://doi.org/10.1002/jid.1698.
Statssa. 2016. Statistics South Africa: Community Survey. Pretoria. https://www.statssa.gov.za/publications/03-01-06/03-01-062016.pdf.
South Africa Gateway. 2018. Infographics. https://southafrica-info.com/land/nine-provinces-south-africa/.
SARB 2020. Total Banks Data. Economic and Financial Data for South Africa. https://wwwrs.resbank.co.za/IFData/SarbData/.
[1] Anarfo, 2019
[2] Sarma and Pais, 2011
[4] Amidžić et al., 2014
[5] Ibid
[6] Lyons and Kass-Hanna, 2019
[7] South Africa Gateway, 2018
Download article
Post a commentary
This comment facility is intended for considered commentaries to stimulate substantive debate. Comments may be screened by an editor before they appear online. To comment one must be registered and logged in.
This comment facility is intended for considered commentaries to stimulate substantive debate. Comments may be screened by an editor before they appear online. Please view "Submitting a commentary" for more information.