Part 2: Fiscal Dimensions of South Africa's crisis
In the first article in this series, we examined the history of SA’s economic policy and some of the roots of its current fiscal crisis. We looked at how economic growth in the country has consistently depended on the global economy and how a commodity-fuelled boom created a mirage of permanent economic growth in many developing countries, which were left without fiscal buffers once the uptick had stagnated or swung downward. In SA’s case, there were also self-inflicted blows, both economic and political, which began after 2007. But despite this, fiscal policy was expansive relying on the hope of increased growth, without sufficient planning for where it would come from. In Part 2 of this series Michael Sachs explains how austerity was implemented, almost by stealth, but without the necessary fiscal consolidation needed to avert a crisis.
A drier season: Austerity without consolidation
Introduction
Dwindling fiscal resources posed a major challenge to an expansive policy agenda. It was assumed that accelerating growth would ease fiscal constraints. No explicit programme to adjust other expenditure commitments or raise additional revenues was required. Meanwhile, a new administration served to splinter and overburden policymaking, while increasingly subordinating technical expertise to the political authority of a rudderless and divided ruling party.
The result, discussed in this article, was a deterioration in the allocation of public resources, increasing reliance on regressive tax instruments, and a fall in the real value of public services received by poor South Africans. While austerity conditions were increasingly felt on the frontline of service delivery, the fiscal consolidation needed to stabilise public finances never took place. At the same time, the public infrastructure boom failed to raise growth or productivity, and instead imposed the additional burden of inefficient state-owned companies directly on the fiscus.
An entrenched budget deficit
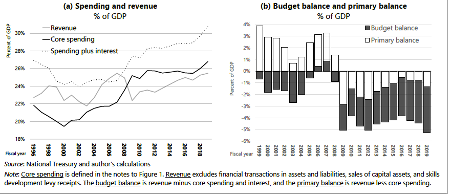
Government’s fiscal policy response to the deceleration of growth was to contain expenditure, while relying on taxation to close the primary balance. Government committed to keep future spending within the nominal limits of the medium term expenditure framework.[1] Consequently, after rising substantially from 2002, core expenditure[2] plateaued as a share of GDP after 2012. In real per-capita terms, spending was slightly lower in 2018/19 than it had been in 2011/12.
Compensation spending was well contained, increasing by only half a percentage point of GDP between 2011 and 2018. Transfers also remained stable as a share of GDP until 2017/18 but then began to increase, as government channelled resources into free university education. Capital spending financed from the budget fell after the 2010 World Cup but recovered over the next five years, driven by growth in municipalities and extra-budgetary agencies. The upward shift in core spending after 2016 reflected the implementation of free university tuition and the expansion of health spending as the public agencies required for national health insurance were established. Above all, spending as a ratio to GDP began to rise as the slowing of economic growth (the denominator) outpaced National Treasury’s efforts to contain expenditure (the numerator).
An effective lid on spending and rising revenue meant that the primary deficit did close year after year, falling to 0.5% of GDP in 2016 (Figure 1) and creating the appearance of credible progress towards a fiscal correction. But the fiscal space created by rising revenue was more than offset by increased debt service costs. The budget deficit of 4-5% of GDP was increasingly devoted to financing the latter.
In 2016, the picture changed radically in the face of a further slowing of economic growth. The progress towards a primary balance was reversed as tax buoyancy suddenly fell, reversing a surprisingly good run in personal income collections.
Figure 1: Core spending, revenue and the deficit
Faith, hope and tax buoyancy
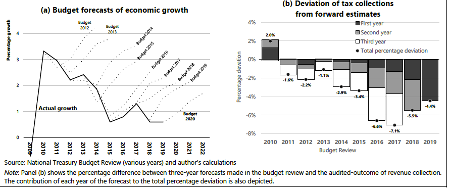
Treasury’s growth projections in successive budgets tell a story of enduring faith in economic recovery and recurring disappointment (see Figure 2 (a)). Other official forecasters and private sector economists were even wider off the mark[3], including the IMF, whose projections were a key assumption in National Treasury’s macro-econometric model. The widely held belief in an economic recovery encouraged a strategy of “kicking the can down the road”.
Also reducing the pressure for fiscal adjustment was that tax collections were remarkably buoyant. Revenue collection outpaced GDP growth, so that between 2010 and 2016 the tax-to-GDP ratio improved every year.
This was almost entirely a result of the surge in personal income tax (PIT) collections between 2012 and 2016. (see Figure 2 (b)) Consumption taxes (mainly VAT and fuel levies) tracked GDP, while taxes on capital, wealth, and corporate income fell sharply after the global financial crisis and have continued to deteriorate. But PIT surged even as growth decelerated. The unusual buoyancy of PIT is explained by several factors. The first were shifts in the balance between profits and wages. As the commodity boom ended, the rents associated with high mineral prices dissipated, leading to a fall in the profit share in national income and a concomitant decline in corporate income tax receipts. Meanwhile, employee earnings continued to outpace the growth of GDP in both the private and public sector, generating buoyant PIT receipts.
Figure 2: Growth and tax: Forward estimates and outcomes
Yet during this period, PIT collections grew even faster than aggregate earnings. A potential explanation for this can be drawn from trends in earnings inequality in the labour market. Labour market earnings are extremely unequal in South Africa and the PIT system is very progressive, which means PIT revenues are strongly concentrated on the upper end of the earnings distribution. Prior to 2012, the Gini coefficient for labour earnings hovered around 0.55 but jumped to 0.7 in 2015.[4] In 2017, earnings inequality eased, at around the same time that compensation growth fell behind GDP growth for the first time. This suggests that the unusual period of PIT buoyancy was correlated with rising inequality in earnings. It may be that affluent South Africans sustained real gains in compensation – driving up tax collections – even as growth slowed and unemployment surged among unskilled and low-income workers who fell below the tax threshold.
A third factor driving PIT buoyancy was the impact of tax policy. During the commodity boom, tax rates had been lowered, and taxpayers were given generous relief through adjustments to the brackets far in excess of inflation. After 2009, this approach was reversed, and government increasingly relied on inflation to increase effective tax rates. In addition, a new top bracket on PIT was introduced in 2015 with a marginal rate of 45 per cent. Other tax increases included rate hikes in dividend withholding tax (in 2012 and 2016), value-added tax (2018), and large adjustments were made to the fuel levy in 2015 and 2016.
Three points arise from this discussion. First, it is sometimes assumed that the fall in revenue after 2016 was related to “state capture” of the revenue service and its consequent disruption by malignant political forces. These events are no doubt significant and do indeed coincide with the slowdown in revenue collection. However, the evidence above suggests underlying economic shifts were probably more important. After 2016, economic growth slowed, and earnings growth slowed even faster. In any case, concerns about the revenue service pivoted around the manipulation of VAT refunds and the impact of the closure of SARS’ “large business unit” on corporate income tax collection. PIT collections had been effectively automated for some time, yet largely account for the shifts in tax buoyancy reviewed here.
Second, the evidence presented on tax rates and fiscal drag suggests a procyclical approach to tax policy in South Africa. While the commodity boom raged, government moved to ease the burden of taxation but increased taxes when faced with a permanent deceleration of growth.
The last issue concerns equity in the distribution of fiscal adjustments. South Africa has a highly progressive tax structure but tax policy over the past decade may have had regressive outcomes. Consumption taxes are the largest source of revenue in South Africa and the combination of VAT and fuel levy hikes since 2009 would have increased the tax burden on the less affluent. The introduction of a new top marginal rate was a progressive step, but the recourse to fiscal drag is regressive because it raises the effective tax rate on middle-income taxpayers, while those whose earnings fall mainly in the top bracket (i.e. above R1.5 million) face little consequence. Finally, wealth taxes (such as estate duty, transfer duty, and local government property taxes) are small as a share of general government revenue, and so taxes on capital are mainly in the form of corporate income tax. These are the subject of generous automatic relief during periods of downturn.
These factors suggest that, on the revenue side, a large share of the burden of fiscal adjustment was felt by less affluent citizens. Meanwhile, the real value of public services on which the poorest rely most (education and health) was eroded by the combination of expenditure constraint and rising wages.
Tight budgets, rising pay, falling services
Tight expenditure control was not backed by explicit policy choices that would reduce spending. This led to a deterioration in the quality of public allocations and an erosion of the value of services. Interest payments outpaced the growth of all other spending and, after 2016, government added free university education to its fiscal obligations. This combination resulted in an implicit choice to constrain capital spending across all government spheres and hold down goods and services budgets as a share of GDP (see Figure 3).
Compensation budgets were contained across national and provincial government. Yet average public sector earnings increased faster than budget allocations. Between 2008 and 2012, annual wage settlements outpaced inflation, and grade progression added another 1.5% to average remuneration. The combination of expenditure containment from above and rising salaries from below, left departments with two responses, both of which led to pressure on the quality of public services. The first was to shift budgets from other line items, leading to shortages in the provision of goods and services, neglect of maintenance, and persistent underspending on planned capital budgets. This resulted in compensation spending rising as a share of the total budget.
The second was to slow hiring and leave vacant positions unfilled, allowing attrition of employees to reduce headcounts. Robust employment growth came to a halt after 2012, and employment levels began to decline in education departments. The service delivery gains in the first period – which reduced the ratio of the population to each public employee – began to deteriorate in education and policing. At the same time, compensation spending per employee continued to outpace inflation by more than 2% in all three sectors, indicating that real gains in remuneration continued, albeit at a slower pace than before 2012 (see Table 2).
Figure 3: Trends in the economic classification of the expenditure (selected items)
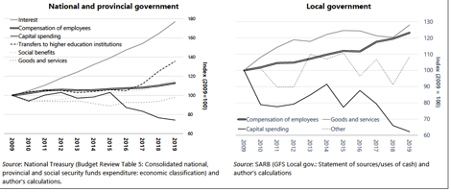
Table 1: Employment and compensation trends in health, education and policing

|
Source: Author’s calculations based on National Treasury, Persal, Stats SA, Department of Basic Education. Note: This table is based on data drawn directly from Persal (government’s payroll system) and provided by the GTAC public expenditure and policy analysis unit. |
Rising pressures on service delivery in the education sector have been apparent for some time. Between 2010 and 2016, the number of permanently employed educators declined by 4%.[5] This has led to rising class sizes, particularly in primary schools. Gustafsson notes:
‘What is worrying is that the overall national patterns show that schools serving poorer communities have seen larger increases in their LE [learner-educator] ratios …Even with some savings resulting from a shift towards younger teachers, the average cost of a teacher is increasing in real terms, and is increasing in excess of the budget trends. The inevitable outcome is thus cuts in personnel numbers.’
Spaull et al[6] show how these pressures have been particularly acute in the poorest provinces.
Similar pressures have been observed in the public healthcare sector. Health budgets grew in real terms until 2012 and then stagnated.[7] While constraints on spending became increasingly binding, cost pressures did not abate. Rising salaries and occupation-specific dispensations were the main element in these pressures, but prices of imported medicine and medical equipment were also pushed up by the continuous depreciation of the rand. Meanwhile, utilisation of public health facilities has continued to grow faster than budgets, straining resources.
If ringfenced allocations for the treatment of HIV/AIDS, TB, malaria, and the rollout of various vaccines, are excluded, resources in the health system have been under significant pressure since 2012.[8] For instance, the Western Cape health department estimated a real budget decline of about R7 billion from 2015/16 to 2018/19. In response, health departments imposed limits on hiring and restrictions on filling (unfunded) vacant posts, centralised procurement, and actively managed medicine purchases. However, the largest “savings” have been in capital spending and infrastructure.
Public spending on health and education account for a large share of the consumption basket of poor South Africans. Using national transfer accounting to estimate the incidence of this spending, Oosthuizen writes that public consumption accounts for between a half and two-thirds of per-capita consumption for Africans under the age of 19 and even more – 45%-54% - for those over 70. Among coloureds, these proportions are 36%-50% and 25%-32% respectively. For whites, however, the respective figures are 9-17% per capita for the young and just 6-7% per-capita for those over 70.
“This reflects the incidence of cash transfers, in the form of social grants to children and the elderly, but also the fact that children are the main beneficiaries of public education, while the elderly make greater use of healthcare than the rest of the population.’[9]
These trends in health and education spending indicate the burden of adjustment has been displaced onto users of public services, including the poorest South Africans.
Pressure at the centre, slippage at the sides
Although core expenditure increased in real terms between 2002 and 2012 and then plateaued, this is not correct for broader definitions of public spending. Government consumption has continued to rise (Figure 4). How can this be reconciled with my claim that spending has been contained for a decade? The answer lies mainly in my definition of “core expenditure”. This measure focuses on budgets that central government can adjust and that are financed out of general taxation and borrowing. However, not all parts of the public sector depend on budget revenue, and many have supplementary sources of income.
Figure 4: Government consumption spending (% of GDP)

|
Source: SARB (Final consumption expenditure by general government), IHSMarkit and author’s calculations |
One example is transfers financed from the skills levy. These are a “direct charge” and not subject to parliamentary appropriation. These transfers do not affect the deficit, as they are financed by a ringfenced payroll tax, and the amount of expenditure is automatically set equal to the taxes collected. The money is channelled to the Sector Education and Training Authorities (SETAs) and the National Skills Fund (in the Department of Higher Education and Training).
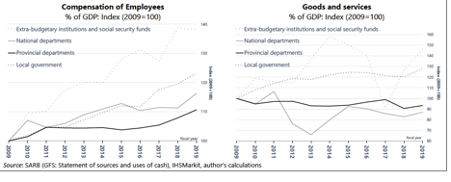
The SETAs are one of about 150 “extra-budgetary institutions” financed partly from transfers out of general taxation, but also through various user charges, levies or taxes, and accounting to various departments of national and provincial government. While a comparatively small subset of expenditure, consumption spending by extra-budgetary institutions and social funds has far outpaced the rest of government. (see Figure 5)
Between 2011 and 2017, consumption spending by provincial departments has been stable as a share of GDP, and its rise since 2017 is largely explained by the slowing of GDP growth. Remarkably, provincial departments spend significantly less on goods and services than they did a decade ago (as a share of GDP). Moderate growth in national government’s compensation spending has been offset by downward pressure on goods and services.
In contrast to this containment, compensation spending by local government is now around 40% larger than it was a decade ago (as a share of GDP). Goods and services expenditure has also escalated strongly. Local government operations are partly funded from the budget but in the affluent urban centres, which account for a large share of the sector’s spending, property taxes finance operations (the only significant tax on wealth in South Africa), while user charges fund the provision of water and electricity.
This evidence suggests that the intense containment of main budget non-interest expenditure has not been matched by similar control of extra budgetary institutions and local government. While there has been pressure at the centre, public consumption growth has continued to slip out the sides, where fiscal controls are less effective.
State-owned enterprises tell a similar story. Although they should be financed by market sales and user charges and are, therefore, defined as outside of “government”, in fact their relative autonomy from fiscal control has, arguably, resulted in an even greater channelling of public resources towards them. Yet they have failed to translate these resources into sustainable and efficient infrastructure development.
Figure 5: Consumption spending by general government
State-owned enterprises and the burden of uneconomic public investment
While the magnitude of government’s investment spending is relatively simple to report, it is more difficult to gauge the value of the assets created by this spending. As Pritchett (1999) points out, spending on public investment is not necessarily equal to the increment in the value of the public capital stock. If the value of the assets produced falls below the cost of producing them, then investment spending is wasteful. [10]
In South Africa, state-owned companies led the infrastructure surge that accompanied the commodity boom. The resources pumped into public infrastructure reached a peak of 8% of GDP in 2009 (adding general government and public enterprises together). Problems emerged for Transnet with the slowdown in commodity prices. By 2015, its investment programmes were scaled down and rescheduled due to “reduced demand and lower prices for commodity exports”.[11] In Eskom’s case, it is likely that poor planning and execution of large infrastructure projects played a bigger role in the collapse of its investment programme.
More broadly, the infrastructure boom of 2007–2016, which was driven by both private and public investments, coincided with a slowdown in economic growth. This is captured by a dramatic increase in South Africa’s incremental capital-output ratio (ICOR), which is a measure of the impact of investment spending on economic growth in the subsequent year.
Janse van Rensberg et al (2019) show that the investment rate increased, but the efficiency of that investment fell:
‘..[I]t has historically taken around 3½ to 6 units of investment to generate a unit of output. Over the past decade, however, the ICOR has worsened steadily. Over the last six years, it has climbed to more than triple its long-term average, and it is now almost four times higher than in the 2000s. Compared with other emerging markets South Africa’s ICOR has gone from being slightly worse than average … to being clearly inferior (behind 82% of peers)…’ [12]
In the 1970s, public investment accounted for more than 50% of capital formation (see Figure 6). This surge in public infrastructure spending coincided with an increase in the ICOR during that decade. In the 2010s, the surge in public investment is comparatively smaller, but the escalation of the ICOR is unprecedented.
One reason might be that public infrastructure spending is not creating truly productive assets. But spending might also appear to be “wasted” because infrastructure is built too far ahead of demand, or because broader expectations of economic growth and demand fail to materialise. Whatever the reason, the “stranded assets” that result impose a financing burden. Where the public sector creates assets with a value below their cost of production, society will be saddled with servicing the liabilities that result.
These costs might be passed onto households and firms in the form of higher tariffs or charges for the use of public infrastructure, one factor behind rapid increases in charges for water, electricity and other “administered prices”. In general, public sector prices have outpaced inflation in the private sector[13]. A significant driver of this divergence may be the costs imposed by poor infrastructure choices. Other factors might include a public-sector wage premium, a tendency to procure goods and services at a mark-up on the market price, corruption or a host of other institutional factors.
Figure 6: Public investment and the incremental capital-output ratio

|
Source: SARB, IHSMarkit and author’s calculations Notes: The incremental capital-output ratio is the annual increment in real GDP divided by last year’s gross fixed capital formation. The graph shows the median value for this ratio over each decade. |
Whatever the case, public sector infrastructure failures contribute to increased prices, which impedes economic development and imposes an unacceptable social burden on households. One way of alleviating this burden is to subsidise the service out of general taxation. This has several consequences. The first is distributional: instead of paying the tariff directly, households and firms carry the burden through increased taxes or through reduced allocations to other spending priorities. The burden does not disappear, but its incidence is distributed differently across the real incomes of households. If the user charge was originally concentrated strongly on the affluent (as was the case with e-tolls on public highways), this shift is likely to be regressive. The second set of consequences concern economic efficiency and the structure of industrial production. The incentive of users to limit their consumption of the infrastructure is lessened. In the case of e-tolls, this means no incentive to avoid congestion. In the case of electricity, more intensive users are effectively subsidised, favouring the use of electricity-intensive production and adding to the externalities associated with carbon emissions.
If government is unable or unwilling to subsidise the price of infrastructure services out of general taxation, it could alternatively “administer” the prices, so that they fall below the real cost of production. But then – unless this is offset by a subsidy paid out of general taxation - a financial imbalance will build up on the books of the agency that provides the service. This will eventually result in a financial crisis playing out on the balance sheet of the entity, requiring a bailout from the fiscus to compensate for the failure to provide a subsidy in the first place.
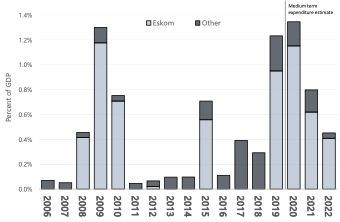
I have excluded “payments for financial assets” from the definition of ‘core expenditure’. They are dominated by transfers to Eskom – R60 billion between 2008 and 2010 in the form of a “subordinated loan” that was later converted to “equity”; further injections of “equity” in 2015 (R23 billion) and 2019 (R49 billion); and a further R112 billion promised for the next few years in the 2020 budget. (See Figure 7)
Figure 7: Payments for financial assets (% of GDP)
|
Source: National Treasury (2020) Chapter 8 (Table 8.2) and Budget Review Table 1 |
Eskom argues that these bailouts are a quasi-fiscal deficit; an unfunded obligation on its books that arises because electricity tariffs do not reflect the true economic cost of electricity production.[14] In this light, we might think of these payments as an implicit subsidy to the price of electricity paid out of general taxation. Instead of passing the true cost of electricity onto firms and households, government has accepted a de facto obligation to subsidise electricity supply.
The Passenger Rail Agency of South Africa (Prasa) provides another example of inefficient capital allocation. Over the past decade, Prasa has received over R103 billion of capital transfers out of general taxation coinciding with the deterioration and collapse of its infrastructure.[15] In addition to capital subsidies, the budget provides Prasa with an operational subsidy of R4–R5 billion per annum. Since its formation in 2009, Prasa’s non-tax revenue (mainly from sales of tickets) has stagnated, as the number of commuters has fallen. This suggests that Prasa’s revival –wholly warranted from an economic development point of view – will require significant increases in subsidies, as well as additional allocations of capital.
Over the past decade, several other large public enterprises and infrastructure projects have – implicitly or explicitly – been subsidised in this way or will have to be subsidised in the future. A case in point is the disarray over electronic tolling in urban centres, which is unresolved after almost a decade. Government appears to have abandoned user charges even for the most affluent. Unless an alternative means to finance this infrastructure is found, national roads will begin to deteriorate in urban centres, leading to gridlock and constraints on economic growth. Pressure will mount for increased taxation, and the only alternative will be to divert resources from townships and rural roads to affluent suburbs. In either case, the abandonment of user charges will certainly have regressive consequences, as the incidence of e-tolls is more progressively distributed than general taxation. More generally, the principle of financing infrastructure in affluent areas through user charges will need to be re-established. If not, the fiscus will be forced into increasingly regressive directions.
Conclusion
In this article, we have shown how the real value of public services – particularly to the poor – has fallen. There has also been a shift in our tax system from generally highly progressive to somewhat less so. Moreover, the allocations to large public enterprises has failed to create productive assets.
In the next article in this series we will examine the depth of the country’s fiscal crisis, particularly as it struggles with the impact of the Covid-19 pandemic and the lockdown.
References
Amra, Rashaad. 2020. Assessing the Performance of National Treasury’s Economic and Fiscal Forecasts. Parliamentary Budget Office.
Amra, Rashaad, and Brandon Ellse. 2018. Assessing the Performance of National Treasury’s Tax Revenue Forecasts. Technical Report. Parliamentary Budget Office.
Blecher, Mark, Aparna Kollipara, Adri Mansvelder, Jonatan Davén, Yasteel Maharaj, and Ogali Gaarekwe. 2017. ‘Healthcare Spending at a Time of Economic Growth and Fiscal Constraint’. South African Health Review 2017(1):25–39.
De Ruyter, Andre. 2020.‘Eskom Key Strategic Priorities’, May 21.
Gustafsson, Martin. 2020. ‘Personal Communication’.
Janse van Rensburg, Theo, David Fowkes, and Erik Visser. 2019. ‘What Happened to the Cycle? Reflection on a Perennial Negative Output Gap’. South African Reserve Bank Occasional Bulletin of Economic Notes OBEN/19/01.
Joubert, Deon. 2019. Quasi Fiscal Deficits and the Price of Electricity. Departmental Seminar Series, Pretoria: UNISA Economics Department.
Mano, Koketso. 2020. ‘Measuring Public Sector CPI’. South African Reserve Bank Occasional Bulletin of Economic Notes 2001.
Merrino, Serena. 2020. Measuring Labour Earnings Inequality in Post-Apartheid South Africa. Vol. 2020. 32nd ed. UNU-WIDER.
National Treasury. 2013. Budget Review, 2013. Pretoria: Government of South Africa.
National Treasury. 2016. Budget Review, 2016. Pretoria: Government of South Africa.
Oosthuizen, Morné. 2019. ‘Inequality and the Generational Economy Race-Disaggregated National Transfer Accounts for South Africa’. WIDER Working Paper (2019/24):54.
Pritchett, Lant. 1999. ‘The Tyranny of Concepts: CUDIE (Cumulated, Depreciated Investment Effort) Is Not Capital’. doi: 10.1596/1813-9450-2341.
Ritchie, Gemma, and amaBhungane. 2020. ‘What’s Left of Prasa’s Rail Infrastructure?’ Daily Maverick, October 2.
Spaull, Nic, Adaiah Lilenstein, and David Carel. 2020. ‘The Race between Teacher Wages and the Budget: The Case of South Africa 2008-2018’. Research on Socioeconomic Policy Group (RESEP), Stellenbosch University.
[1] National Treasury, 2013
[2] Main budget non-interest spending excluding payments for financial assets
[3] See Amra (2020), Amra and Ellse (2018)
[4] Merrino (2020)
[5] Gustaffson (2017)
[6] Spaull et al (2020)
[7] Blecher et al (2017)
[8] Ibid
[9] Oosthuizen (2019)
[10] Pritchett (1999)
[11] National Treasury, 2016
[12] Van Rensberg, J et al (2019)
[13] Mano (2020)
[14] Joubert (2019); De Ruyter (2020)
[15] Ritchie; amaBhungane (2020)
Download article
Post a commentary
This comment facility is intended for considered commentaries to stimulate substantive debate. Comments may be screened by an editor before they appear online. To comment one must be registered and logged in.
This comment facility is intended for considered commentaries to stimulate substantive debate. Comments may be screened by an editor before they appear online. Please view "Submitting a commentary" for more information.