Has the Employment Tax Incentive created jobs?
Introduction
The Employment Tax Incentive (ETI) is probably the South African government’s most prominent labour-market intervention in the past decade. Providing tax credits to firms for hiring young workers earning less than R6500 per month, the policy aims to address, or at least mitigate, South Africa’s exceptionally high rate of youth joblessness by encouraging targeted private-sector job creation.
First implemented in 2014, the policy has been renewed or expanded three times, most recently until 2029. Tax credits worth R4.8 billion were paid out to firms in 2019/20 [1] and the policy was dramatically expanded during the pandemic period.[2]
But does the ETI actually have an employment effect? Firms may be claiming the subsidy on new young workers they would have hired anyway. The evidence as to whether the policy creates jobs has been mixed and contradictory.
Our recent research shows that the existing evidence of the ETI having increased employment is affected by important methodological challenges.[3] While we present some new preliminary, suggestive evidence of the ETI having created jobs for young people, other methodologically credible (though not infallible) evidence points to the policy having had no effect. At this stage we believe there is insufficient evidence to make categorical conclusions about the effects of the policy.
The existing literature
Two broad methodologies have been used to estimate the employment effects of the ETI. Both use versions of the popular difference-in-differences (DiD) research design. The DiD design entails splitting individuals or firms into two groups – a treatment group and a control group. The key DiD assumption is that were it not for the policy, the outcome of interest (in this case employment) would have evolved similarly over time for these two groups. If we see that after the policy comes into effect employment increases more for the treated group than the control group, then we attribute this to a causal effect of the policy.
Ranchhod and Finn (2015, 2016) and Ebrahim (2020a)[4] compare the employment prospects over time of individuals who are eligible for the ETI (the treatment group, e.g. young workers) with those who are not (the control group, e.g. old workers). All three papers find that the introduction of the ETI did not increase the employment probabilities of eligible individuals relative to ineligible individuals. They produce quite precise estimates of null effects of the policy.
One potential weakness of these approaches is the assumption that older workers’ employment remains unaffected by the ETI. Saez et al (2019) finds that a similar policy in Sweden increased both eligible and ineligible workers’ wages, as firms used the subsidy to satisfy credit constraints and expand their business. If a similar mechanism was at work in South Africa, the worker-level approach could underestimate ETI effects.
Another approach is to compare firms rather than individuals. Ebrahim (2020b)[5] and Bhorat et al (2020) examine how employment changes at firms that claim the ETI versus those that don’t. It is these papers that find positive effects of the ETI: employment increases faster at firms that claim the subsidy.
We sought to implement our own firm-level analysis, attempting to reconcile these apparently contradictory results and explore additional effects of the ETI beyond those on employment.
The difficulty with the firm-level approach is that firms that claim the ETI are very different from those that don’t. We show that ETI-claiming firms are bigger and grow faster than non-claiming firms even before the ETI policy comes into effect. This is to be expected – the ETI is essentially free money for firms apart from its administration cost and perhaps increased regulatory scrutiny. ETI-claiming firms are likely to be more professionally run than non-claiming firms, on average.
If this is not adequately controlled for, a DiD design will lead to upwardly biased estimates of employment effects. We observe employment at ETI-claiming firms increasing more than non-claiming firms after the policy is implemented, but not because of the policy – the policy is claimed by firms that would have grown faster even without it.
Ebrahim et al (2020b) and Bhorat et al (2020) are aware of this issue and try to address it by combining their DiD design with “matching.” While there are various ways to implement a matched DiD design, the core idea is to first select a group of non-ETI firms that look comparable to the ETI firms (this is the “matching” part) and use only these firms when comparing with ETI firms in the DiD analysis. The hope is that because the selected firms are observably similar, any differential change in employment around the time of the policy must be because of the policy, not just because there are different kinds of firms in each group.
The problem with the firm-level results
Our research suggests these firm-level matched DiD approaches are unlikely to work. Using the anonymised worker-firm tax data at the National Treasury-South African Revenue Services (NT-SARS) Secure Data Facility, we conducted our own firm-level matched DiD analysis.
A standard test for the credibility of a DiD design is the so-called “pre-trends test”. Essentially this is a test of whether the treatment and control groups have divergent growth paths even before the policy comes into effect. If that is so, then the control group is probably not a good counterfactual for the treated group after the policy comes into effect either, and DiD estimates based on this post-treatment divergence will be biased.
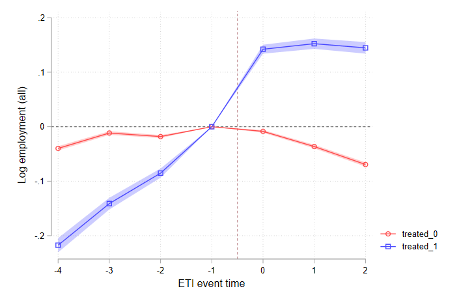
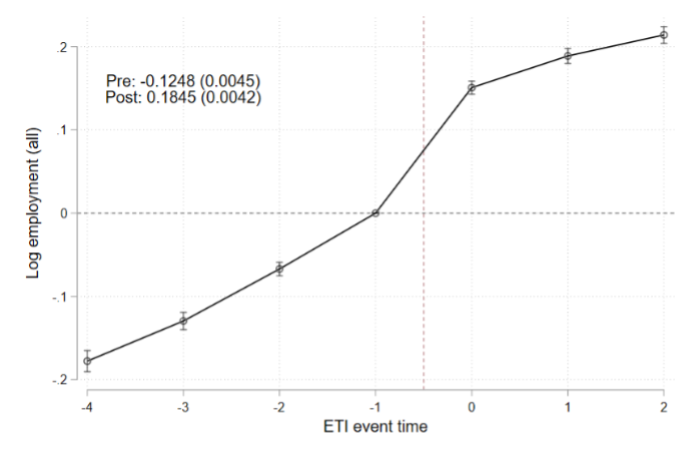
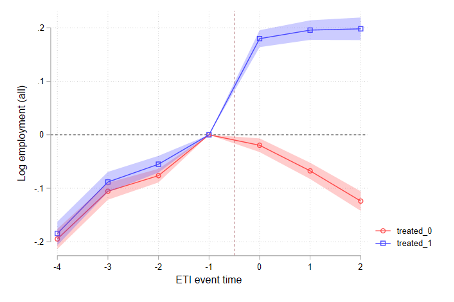
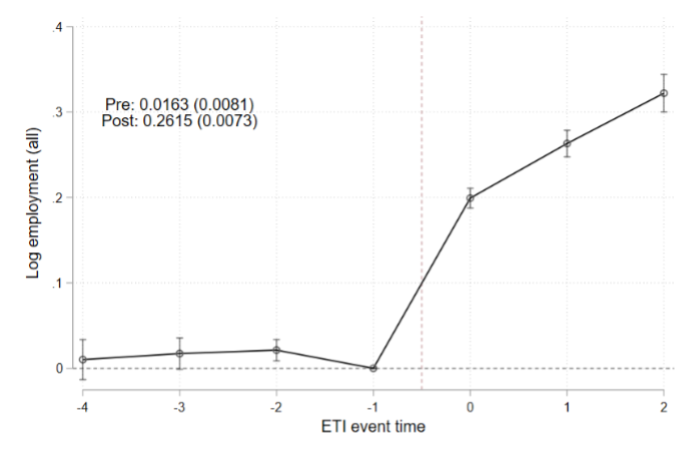
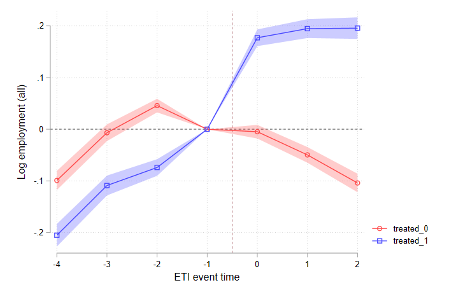
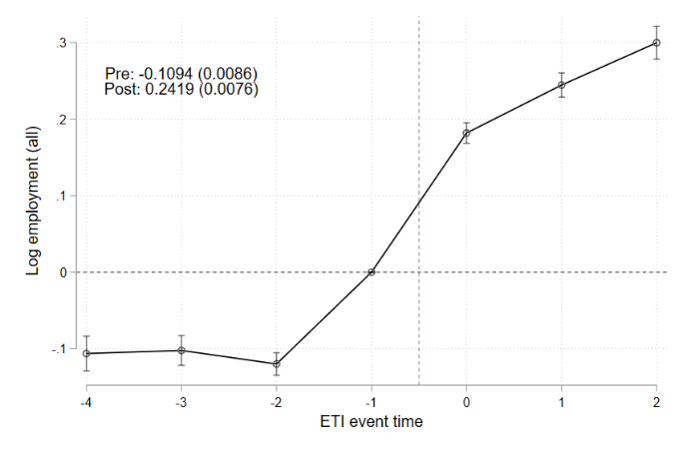
Figure 1 shows a standard “event study” graph that illustrates these issues. The x-axis shows different years, where period 0 is the year a firm first claims the ETI, period 1 is the second year of ETI-claiming, period -1 is the year preceding ETI-claiming, and so on. For the graphs on the left, the blue line shows how employment evolves for the ETI-claiming firms, while the red does the same for the non-ETI claiming control group. The graphs on the right show the difference between ETI and non-ETI firms. For each group, employment is relative to its level in the period immediately preceding treatment, period -1, which is normalized to 0.
Panel (a) shows that even before the policy comes into effect (periods -4 to -1), employment grows faster at ETI firms than non-ETI firms. We therefore cannot interpret the post-treatment (periods 0 to 2) divergence between the groups as a causal effect of the policy.
Panel (b) shows what happens if we implement a matched DiD design (specifically we use propensity score inverse probability weighting). Now the red line is employment at the selected group of “matched” non-ETI firms, which we have determined are comparable to the ETI firms. In this case the pre-trend test looks good – the treatment and matched control firms follow similar employment paths until the policy is implemented, at which point there is a sudden and dramatic divergence. This would seem to be evidence that matching works and there are large ETI employment effects.
The problem is that the result in Panel (b) is highly sensitive to how one implements the matching process. For Panel (b), we select our group of matched control firms by choosing those non-ETI firms that look similar to ETI firms in period -1, which is standard in the literature. For example, these could be non-ETI firms that have many employees, relatively high revenues, and a high proportion of young employees in period -1, like ETI firms.
In Panel (c), we select our group of matched control firms by choosing those non-ETI firms that look similar to ETI firms in period -2. The picture now looks very different. While the treated and control groups’ employment growth (the slope of the lines) match very well up until period -2, they diverge suddenly from period -1 onwards. Taken at face value, this would seem to suggest that the ETI dramatically increases employment at ETI firms before they even claim the policy!
This kind of “placebo” test shows that the matching process is not really working. While it makes the control group comparable to the treatment group up until the period used for matching, the control group does not remain a good counterfactual for the treatment group in the periods after the matching period. And yet this is the period we care about for estimating treatment effects. We cannot tell how much of the post-treatment divergence in Panel (b) is due to the effects of the ETI, and how much is simply due to our control group being a poor counterfactual after the matching period, as we see in Panel (c).
Why does the matching process fail in this peculiar way? Our simulations suggest that this is caused by a newly identified “mean reversion” issue in matched DiD specifications.[6] The idea is that ETI and non-ETI firms are so different that when the matching process chooses non-ETI firms that have similar employment levels in period -1 (for example) as ETI firms, it is mainly choosing non-ETI firms that had strange and atypical “shocks” to employment in that period, and they subsequently “revert” to their usual employment levels in subsequent periods. Not only does this mean the matching process doesn’t identify a control group that is similar to ETI firms, but this reversion behaviour in the control group can cause additional bias by itself. This is a topic we are still exploring.
Figure 1: ETI event studies with different specifications
|
Panel a) Unconditional difference-in-difference (no matching) |
|
 |
 |
|
Panel b): Matched difference-in-differences; matching in period -1 |
|
 |
 |
|
Panel c): Matched difference-in-differences; matching in period -2 |
|
 |
 |
Can we say anything using firm-level DiD?
It’s important to recognize that our analysis above is not evidence that the ETI doesn’t create jobs. It is instead a methodological point, suggesting that the matched DiD approach simply doesn’t work in the case of the ETI, and we can’t use it to conclude on the effects of the ETI.
In this context it is natural to investigate other approaches that could provide a more substantive result.
While the panels in Figure 1 mainly show how non-ETI firms serve as a poor control group, because they and ETI firms have different long-run employment trends, there does seem to be a slight above-trend jump in employment at ETI firms when they claim the policy (i.e. between period -1 and 0). This is even more pronounced when looking specifically at youth employment. Is this itself evidence of an ETI employment effect?
The formal way to test for this in a DiD framework is to control for parametric time trends. We directly model the divergence between the treated and control group in the pre-period (e.g. we assume their employment trends diverge linearly), and then see if there is an above-trend divergence after treatment occurs. The problem with this approach is that results can be very sensitive to how we specify time trends and there is often little reason to favour one specification over another.
In this context, a so-called “partial identification” approach can be useful (also called “set identification”). Rather than focusing on the estimated treatment effect associated with one parametric time trend assumption, we allow a reasonable range of parametric time trends, and then get a range of treatment effects associated with this subset of parameters. In particular, we implement the Rambachan and Roth (2022) partial identification approach.
We find that ETI firms seem to increase youth employment more than non-ETI firms after the policy comes into effect. For the full range of time trends we consider plausible, there is a statistically significant, positive trend-break in youth employment at ETI firms.
This is clearly evidence of an ETI youth employment effect. But some important caveats need to be kept in mind when interpreting this result.
Firstly, the partial identification approach doesn’t tell us much about the size of the youth employment effect. A firm-level employment increase of 1% and 19% are both within the range of estimates. While these might both be statistically significantly different from zero, they have vastly different policy implications.
It also seems that the ETI employment effect might dissipate over the three-year post-policy claiming period we look at. This is substantively concerning, as the aim of the ETI is to create a durable increase in youth jobs.
But it also prompts some methodological concerns. It might be the case that ETI firms claim the policy when they know they are about to embark on a significant hiring expansion anyway, when the policy provides its greatest benefits. This could mean that the ETI doesn’t actually create jobs, and the coincidence of ETI-claiming and hiring expansion is more about when firms choose to opt into treatment. Indeed, there is even some (weak) evidence of older, ineligible-worker employment increasing in the first period after claiming the ETI. This might be a real causal effect, but certainly deserves further investigation, and it forms part of our ongoing research.
We therefore see this partial identification evidence as preliminary and suggestive rather than conclusive, and it must be interpreted together with the stronger worker-level evidence that finds no ETI-employment effects.
The way ahead
When the ETI was first introduced, it was justified on the basis of academic work that was not conceptually appropriate for the purpose of evaluating the prospects of the policy.[7]
Since then, the policy has been expanded and extended without clear evidence that it works. Government may say that it is nonetheless worth persisting with the programme as a policy experiment, as few alternative policies have been proposed that seek to increase private-sector labour absorption. But the costs of the policy are not negligible and constitute a substantial transfer from the fiscus to big business.
If the policy is to remain, wholesale extensions and expansions seem hard to justify in light of the current evidence. Perhaps rigorous policy experiments targeted to particular sectors or types of firms are more reasonable and should be prioritized before further policy extensions can be recommended.
Unfortunately, the ETI has turned out to be a difficult policy to evaluate. Different approaches yield apparently contradictory results, and commonly used methodologies seem to simply fail. The evidence in favour of the ETI is weaker than was previously understood. Whatever the path taken, a fuller and more careful and sceptical engagement with the evidence seems well-advised.
Declaration of interests: Budlender has done consulting work for the South African Presidency and National Treasury concerning social grants. Ebrahim has provided policy advice to National Treasury on the topic of the Employment Tax Incentive and has written about the policy with National Treasury officials. The authors declare that, to the best of their knowledge, no officials of any entity have attempted to unduly influence the results or framing of this research.
This research was conducted under the auspices of the SA-TIED programme, a partnership between UNU-WIDER, National Treasury and the International Food Policy Research Institute.
References
Bassier, I., Budlender, J. and Ranchhod, V. 2022. “The complexities of evidence-based policymaking”. SALDRU Newsletter, 30 March. Available at: <https://www.saldru.uct.ac.za/2022/03/30/the-complexities-of-evidence-bas... [Accessed 18 October 2022].
Bhorat, H., Hill, R., Khan, S., Lilenstein, K. and Stanwix, B. 2020. “The Employment Tax Incentive Scheme in South Africa: An Impact Assessment”. DPRU Working Paper 202007, Development Policy Research Unit.
Budlender, J. and Ebrahim, A. 2021. “Estimating Employment Responses to South Africa’s Employment Tax Incentive”. SA-TIED Working Paper No. 187, UNU-WIDER.
Daw, J. and Hatfield, L. 2018. “Matching and Regression to the Mean in Difference-in-Differences Analysis”. Health Services Research, 53(6):4138-4156.
Ebrahim, A. 2020a. “A policy for the jobless youth: The Employment Tax Incentive”, chapter 5, pages 112-146. University of Cape Town. PhD Thesis.
Ebrahim, A. 2020b. “A policy for the jobless youth: The Employment Tax Incentive”, chapter 4, pages 85-111. University of Cape Town. PhD Thesis.
Ebrahim, A. and Gumbi, S. 2022. “Expanding a wage subsidy during lockdown”. WIDER Background Note 1/2022, UNU-WIDER.
Ebrahim, A., Leibbrandt, M. and Ranchhod, V. (2017). “The effects of the employment tax incentive on South African employment”. WIDER Working Paper 2017/5, UNU-WIDER.
Ebrahim, A. and Pirttilä, J. 2019. “Can a wage subsidy system help reduce 50 per cent youth unemployment: Evidence from South Africa”. WIDER Working Paper 2019/28, UNU-WIDER.
Muller, S. 2021. “Evidence for a YETI? A Cautionary Tale from South Africa’s Youth Employment Tax Incentive”. Development and Change, 52(6):1-42.
National Treasury of South Africa. 2022. Budget Review 2022. National Treasury of South Africa, Pretoria, South Africa
Rambachan, A. and Roth, J. 2022. “A More Credible Approach to Parallel Trends”. Review of Economic Studies, forthcoming.
Ranchhod, V. and Finn, A. 2015. “Estimating the effects of South Africa’s youth employment tax incentive-an update”. SALDRU Working Paper 152, Southern Africa Labour and Development Research Unit.
Ranchhod, V. and Finn, A. 2016. “Estimating the Short Run Effects of South Africa’s Employment Tax Incentive on Youth Employment Probabilities using A Difference-in-Differences Approach”. South African Journal of Economics, 84(2):199-216.
Saez, E., Schoefer, B. and Seim, D. 2019. “Payroll Taxes, Firm Behavior and Rent Sharing: Evidence from a Young Workers’ Tax Cut in Sweden”. American Economic Review, 109(5):1717-1763.
[1] National Treasury, 2022
[2] Ebrahim and Gumbi, 2022
[3] Budlender and Ebrahim, 2021.
[4] The earliest version of Ebrahim (2020a) was first published as Ebrahim and Pirttilä (2019). Ebrahim (2020a) is a PhD chapter, which we cite as the latest version of this work
[5] The earliest version of Ebrahim (2020b) was first published as Ebrahim et al. (2017). Ebrahim (2020b) is a PhD chapter, which we cite as the latest version of this work.
[6] Daw and Hatfield, 2018
[7] See Muller, 2021; Bassier et al, 2022
Download article
Post a commentary
This comment facility is intended for considered commentaries to stimulate substantive debate. Comments may be screened by an editor before they appear online. To comment one must be registered and logged in.
This comment facility is intended for considered commentaries to stimulate substantive debate. Comments may be screened by an editor before they appear online. Please view "Submitting a commentary" for more information.
