Part 1: Fiscal dimensions of South Africa's crisis
This is the first in a series of four articles exploring the background, dimensions and possible policy options to the fiscal crisis South Africa faces. It is edited into extracts from a long paper prepared by the author as part of the SA Future Economy project at the Wits School of Governance.[1]
Part 1: The sound of thunder
Introduction
How did South Africa arrive at the fiscal crisis it currently faces? It was once thought that the democratic breakthrough of 1994 had heralded a “fiscal renaissance”[2], but the institutions and policy certainties that undergirded this confidence now face a bleak and painful reckoning.
In search of answers, this series of articles reviews fiscal data and policy development over the past two decades.
South Africa’s crisis is multidimensional, and a single lens such as fiscal policy is inevitably limited. Nevertheless, it can help illuminate a wider terrain of historical change. As Schumpeter famously said: “[t]he spirit of a people, its cultural level, its social structure, the deeds its policy may prepare – all this and more is written in its fiscal history, stripped of all phrases. He who knows how to listen to its message here discerns the thunder of world history more clearly than anywhere else.” [3] An exaggerated claim no doubt, but there is truth enough in it.
In this article, I show that the large expansion of public sector commitments in the decade after 2002 was deliberate and well-targeted. It included a permanent expansion of core public services (basic education, health and policing), an increase in pro-poor fiscal transfers, significant real improvements in the remuneration of public employees, and a surge in public infrastructure investment.
Once these new commitments were entrenched, however, the fiscal policy context changed fundamentally in two ways. First, the surge in South Africa’s terms of trade (associated with the commodity price cycle) came to an end after 2011. This was the most important cause of the economic stagnation that followed. Domestic constraints – such as electricity supply disruptions or rising corruption – were initially of secondary importance, and South Africa’s growth path largely followed that of its commodity-exporting peers. Second, the policy and governance environment in which fiscal policy operated changed after the ANC’s Polokwane conference in 2007. This resulted in a fragmentation of political power and a shift of policy authority from the constitutional structures of government to opaque and diffuse processes within the ANC. In the face of slowing growth, government failed to confront the imperative for fiscal adjustment. It committed itself to further expansions of public services but did not articulate a fiscal programme to support these aspirations. Government relied on the assumption that economic growth would accelerate. However, a second blow to economic growth occurred after 2015, as investment (both private and public) collapsed in the face of incoherent policy, regulatory capture, and an intensifying fiscal crisis.
In Part 2 of this series, I will look in greater detail at the fiscal weaknesses and imbalances that have built up over the past decade. Part 3 looks at the current fiscal predicament, which has been significantly worsened by the Covid-19 crisis. The fiscal position is shown to be profoundly unsustainable. Part 4 considers policy options, among them arguments for central bank intervention to backstop the fiscal position.
Permanent fiscal commitments
Prior to the first democratic elections in 1994 the African National Congress (ANC) set out its economic programme for post-apartheid South Africa. The Reconstruction and Development Programme (RDP) made clear that:
“[G]overnment policy and mechanisms of raising finance are crucial to the success of the RDP. If they were to cause excessive inflation or serious balance of payments problems, they would worsen the position of the poor, curtail growth and cause the RDP to fail. Government contributions to the financing of the RDP must, therefore, avoid undue inflation and balance of payments difficulties. In the long run, the RDP will redirect government spending rather than increasing it as a proportion of GDP.”[4]
Once in government, the ANC did not immediately take over the key economic functions, such as finance minister and central bank governor. In 1985, global banks had dealt the apartheid state a devastating blow by refusing to roll over South Africa’s debts. For several years before the election, the ANC had argued in favour of policies that would support capital inflows. The fledgling democratic state needed to restore the inflow of foreign savings and unlock the balance of payments constraint, and so continued down the path of liberalisation, open capital markets and fiscal prudence opened by its apartheid predecessor.[5]
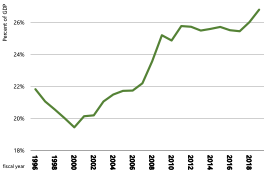
Figure 1: Main budget core spending (1996–2019)

|
(a) Real spending per person |
(b) Share of GDP |
|
Sources: National Treasury, Stat SA, IHSMarkit, author’s calculations Note: I define “core spending” as main budget non-interest spending excluding self-financing items and payments for financial assets. I have excluded debt service costs, payments funded by the skills levy, and the fuel-levy sharing with metros. All of these are “direct charges against the National Revenue Fund and are not appropriated by parliamentary vote. I have also excluded payment for financial assets. This line is dominated by very large payments to Eskom in 2009, 2015 and 2018, and smaller payments to other state-owned enterprises. |
|
In 1996, soon after the appointment of the first ANC Finance Minister and in the wake of the market turmoil that followed, government re-committed itself to fiscal prudence with the Growth, Employment, and Redistribution (GEAR) strategy. While GEAR represented continuity in macroeconomic policy, it implied a new political approach to engagement with party militants, trade unions, and civil society groups that constituted the ANC’s broader activist base. In effect, the ANC sought to establish credibility with foreign investors by demonstrating its capacity to discipline and marginalise its mass base.[6]
GEAR aimed to cut the budget deficit, avoid permanent increases in the overall tax burden, reduce public consumption spending, and raise government’s contribution to fixed investment. A rebalancing in the composition of expenditure would reduce the sum of wages, transfers, and the procurement of goods and services by three percentage points of GDP by the year 2000, to enable an increase in RDP-related capital spending.[7] This led to the downsizing of public service employment levels over the next five years[8], a process that coincided with integration of apartheid’s divided racial bureaucracies and the reallocation of public spending towards the imperatives of democratic rule [9].
Figure 1 shows the evolution of spending since the 1996 fiscal year. I have defined “core expenditure” to reflect spending under the direct control of central government (excluding interest payments and other mandated spending). The fiscal consolidation associated with GEAR is clear to see between 1996 and 2000, but this is dwarfed by the rise in expenditure that followed. Over the decade from 2001, spending grew at a real rate of 7% each year on average. In today’s prices, between 1999 and 2011 government spending for each South African rose from R12 300 to R24 200. Tax rates were also eased between 1994 and 2009: the corporate income tax rate was lowered from 40% to 28%; the top rate on personal income was lowered from 44% in 1999 to 40% in 2002, while relief for fiscal drag was provided far in excess of inflation.
Four elements were behind increased spending in the decade after 2002: an expansion of resource allocation to health, education, and policing; improved remuneration for public servants; a rise in transfer payments to poor households; and a surge in infrastructure spending.
- Expansion of core government services: Health, education and policing are the most labour-intensive of government services, absorbing 50% of the national budget but more than 70% of compensation spending. Extending these services necessarily entails increasing employment levels. Between 2002 and 2012 police numbers increased by more than 50%, while employment in provincial health departments grew by 44% (see Table 1). In both cases, the population served on average by each employee fell significantly. The growth in education employment was more moderate but made similarly impressive gains relative to the number of enrolled learners.
- Improved remuneration for public servants: Agreements reached in 2007 resulted in vastly improved conditions of service for public employees. They also entrenched routine annual grade progression, ostensibly linked to performance assessments, but nearly universal in practice. This added 1.5% to the annual growth rate of the salary bill over and above the annually negotiated “cost-of-living adjustments” (typically pegged above inflation). Provincial spending per employee in health departments outpaced consumer inflation by an annual average of nearly 5% over the decade, and for education about 4%.
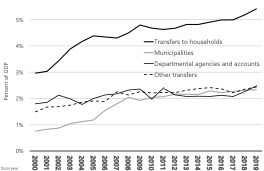
- A rise in transfer payments to poor households: Transfers outpaced the surge in compensation spending. This expansion had two parts. First, cash transfers to households (i.e. social grants and similar payments) increased from 3% of GDP in 2001 to 4.6% a decade later. This line item also includes subsidies to university students from poor households, which accounts for the increase after 2016. Second (and equally significant), the funding of free basic water and electricity for poor households was financed through transfers to local government starting in 2001. These transfers increased from 0.8% to 2% of GDP over the period.
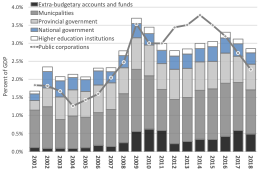
- A surge in infrastructure spending: Complementing the increases in recurrent transfers and consumption was a surge in capital spending. Figure 3 distinguishes between outlays largely financed from the budget (in bars) and infrastructure spending leveraged from the balance sheets of state-owned companies (the line). The former includes capital transfers from the main budget, which financed an expansion of capital spending by municipalities, provinces and national departments, and supported the investment programmes of public agencies responsible for roads, water systems, and passenger rail. The budget also supported large projects such as the Gautrain and stadium construction in preparation for the 2010 World Cup. At the same time Eskom inaugurated a new build programme in response to the first incidents of load shedding in 2007, while capital formation by Transnet doubled as a share of GDP, rising from 1% to 2.1% of GDP between 2005 and 2009.
All through this extension of budgets, government ran a primary surplus (the difference between revenue and non-interest spending: a primary surplus is a positive primary balance). Despite the easing of tax rates, rapid economic growth ensured that taxation remained buoyant. Improving commodity prices coincided with the longest business cycle upswing in South Africa’s history and an easing of global financing conditions. This combination of factors created a false sense of fiscal sustainability by reducing the costs of debt servicing and so expanding the apparent fiscal space for the provision of social services
|
Table 1: Employment and real compensation in health, education and police
Source: Author’s calculations based on the following data. Employees and spending: National Treasury: Intergovernmental fiscal reviews: 2003, 2004 and 2014; Estimates of National Expenditure: 2003) and 2014; CPI deflator and mid-year population estimates: Stats SA; IHSMarkit. Learners enrolled in public school system: Department of Basic Education and Gustafsson (2020). Note: Health and education employee numbers and compensation spending reflect the budgets for headcounts and compensation of both professional and administrative employees in provincial government. Employment in the relevant national and municipal functions is excluded from both these sectors. Police reflects total employment in the national budget vote for safety and security. It excludes provincial and local employees carrying out policing functions and includes many employees who may not be police officers. Compensation spending is deflated using a headline consumer price index. |

Figure 2: Core spending by national, province and social security funds as a share of GDP
|
Figure 3: Capital spending by public sector institutions (2001-2018)
|
Figure 4: Spending on defence and interest payments (1982–2014)
|
|
Source: Stats SA (Actual capital expenditure by type of public sector institution, P9101 – Table B), SARB; IHSMarkit; author’s calculations Note: A distinction is made between spending financed largely out of general taxation and utility charges (bars) and those financed on the balance sheets of state-owned companies (the line). Extra-budgetary accounts and funds in this (Stats SA) dataset includes public utilities operating passenger rail, national roads, water infrastructure. |
Source: SARB, IHSMarkit, author’s calculations. Note: This data is drawn from SARB data on functional classification of expenditure by consolidated general government. Interest payments is denoted ‘public debt transactions’ in this dataset |
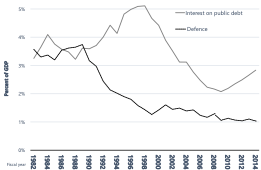
Fiscal space was also created by reducing defence spending. With the demise of apartheid, South Africa’s defence force withdrew from battlefields in southern Africa and deployments against political resistance at home. As Figure 4 shows, the windfall from reduced defence spending was concentrated in the years between 1989 and 2000. Although defence spending increased with the arms deal in 2001, it was driven down to 1% of GDP in the years that followed.
In contrast with the RDPs commitment to “redirect government spending rather than increasing it as a proportion of GDP”, the fiscal consolidation associated with GEAR was followed by a large expansion of public consumption and a simultaneous easing of the tax burden. Although ultimately unsustainable, the spending increase was well directed. Concerns about crime, both as a social problem and a constraint to faster economic growth, were widespread. Similarly, improved basic education and healthcare were (and still are) regarded as essential for social development and economic expansion. In 2007, the first incidents of load shedding alerted South Africans to the inadequacy of economic infrastructure.
Had these expanded resource allocations led to sustained progress in the quality of public services and been accompanied by improved industrial investment, trade competitiveness and productivity, they might have formed part of a new dynamic of self-reinforcing growth and development. Had global dynamics remained supportive, the result might have been a sustainable fiscal path. Instead, the extension of fiscal commitments and surge in public infrastructure investment was followed by a permanent fall in GDP growth.
The world changes
With hindsight, it is not difficult to see why government was upbeat about South Africa’s prospects in the first decade of the millennium. As the global commodity boom kicked in, economic growth accelerated, capital inflows were buoyant, the rand was strong, and inflation and interest rates benign.[10] Despite the extension of fiscal commitments, government maintained a primary balance backed by rapid growth and buoyant revenue. The combination of these forces brought the debt-to-GDP ratio down to historic lows, and the budget balance moved into surplus.
However, two factors changed the conditions under which fiscal policy operated. Global economic developments redefined macroeconomic fundamentals, as the historic surge in the terms of trade that had driven South Africa’s growth came to an end in 2011. Coinciding with this was the change in domestic political conditions that had begun with the ANC’s Polokwane conference in 2007. At the very moment that the slowdown in growth demanded fiscal adjustment, government policy became increasingly incoherent. This enfeeblement of public institutions eventually led to a collapse in investment and a second blow to growth after 2015.
Global shifts and South Africa’s slowdown
The financial crisis of 2009 was a heavy blow, but one that South Africa weathered better than most. The contraction was initially severe, but the economy rebounded over the next two years (see Figure 5). The 2010 World Cup preparations lifted private-sector confidence and supported a strong recovery in private investment, which complemented the public sector’s ongoing surge in infrastructure spending. Fiscal expansion in developed countries buoyed global demand, and South Africa’s export volumes surged. Commodity prices strengthened once more, as Chinese growth rebounded.
However, after 2011, China’s growth began to slow and commodity prices followed. Almost simultaneously, the European Union curtailed public spending and shifted from a current account deficit to surplus, imposing deflationary pressures on the world economy.[11] South Africa began to decelerate.
In the 1990s, growth averaged 2.9% – a return to the historical average of 3%.[12] The global turbulence of the Asian crisis and fiscal consolidation at home weighed down on growth in the late 1990s, moderating hopes for a sustained economic dividend for the post-apartheid state. But redemption appeared to beckon as the new millennium dawned. Over the next decade, growth rates averaged 4.2% – the longest and strongest growth acceleration on record. Policymakers may have hoped this represented a new normal, spurred by a stronger macro-policy framework and world-class institutions, but it was not sustained. From 2014, output per capita began to decline and has continued to do so until today.
Hoping that the deceleration would be temporary and cyclical, government premised its fiscal strategy on an economic recovery. In November 2010, it published the “New Growth Path”, which emphasised the “counter-cyclical” role of macroeconomic policy and mandated continuing efforts to leverage the balance sheets of state-owned companies behind public infrastructure investment.
Fiscal policy remained expansive and, with no moderation in expenditure levels, large deficits emerged as the consequence of revenue shortfalls. Public infrastructure investment continued its robust growth and real interest rates began to fall, turning negative in 2011. Despite this, the rate of economic growth continued to decelerate, apparently impervious to macroeconomic stimulus
Figure 5: GDP growth (1990–2019)

|
Source: SARB, IHSMarkit and author’s calculation |
Havemann and Kirby (2020: 2) look at patterns of South African growth over more than 300 years and find that “global growth is the single most important long-run determinant of South African growth”. Prior to 2010, South Africa tracked global growth but then diverged from the world average. This has been taken as evidence that in the last decade domestic and idiosyncratic factors have been the primary explanation for the slowdown. But South Africa was not alone in diverging from the world average after 2010. South Africa’s growth trajectory can be explained to a great extent by global developments. Until 2011, China’s rapid industrialisation had raised the price of commodity exports, while lowering the price on imported wage goods. This altered the terms of trade for developing countries reliant on non-fuel commodity exports, with important consequences for growth, distribution and opportunities for industrial development.[13]
Commodity-linked revenues directly account for a small share of tax revenue. However, commodity prices have deep impacts across an economy whose production structure remains rooted in minerals and energy.[14] Raw and semi-processed minerals still account for the bulk of South Africa’s exports, while non-commodity exports – manufactured goods and services – are increasingly focused on Africa, where growth prospects are even more strongly tied to commodity prices.[15]
From 1970, the commodity price cycle swung up dramatically, reaching a peak in 1980 and then falling towards a trough around the turn of the millennium. This sets the stage for the “super cycle” between 2002 and 2012 that was driven by China’s rapid industrialisation.
Pritchett (2000: 221) points out that thinking about growth in terms of a business cycle around a stable trend of potential output may not be appropriate for developing countries: ‘[A]lmost nothing that is true of U.S. GDP per capita (or that of other countries of the Organisation for Economic Co-operation and Development) is true of the growth experience of developing countries. A single time trend does not adequately characterise the evolution of GDP per capita in most developing countries.’
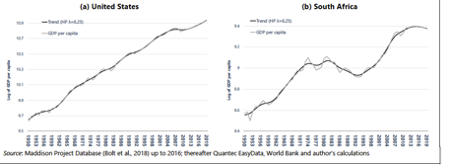
This difference can be seen when comparing patterns of growth in South Africa and the USA. (Figure 6). Until the mid-2000s, the USA’s growth rate shows a relatively linear trend, whereas the picture for South Africa is very different, with periodic accelerations and decelerations lasting over a decade or more. Solid output growth in the 1950s and 1960s is supplanted by falling GDP per capita, reflecting the structural crisis of the apartheid economy and coinciding with the turn in the commodity price cycle. In the 1990s, growth is restored and its momentum accelerates through the commodity boom. But another shift in the trajectory of growth appears to loom as the time series comes to an end in 2016.
Figure 6: GDP per capita: USA and South Africa (1950–2019)
A second (self-inflicted) blow to growth
The causes of South Africa’s slowdown were not solely global. In 2007, at the height of the growth upswing, blackouts across the national electricity grid began. Although power shortages would certainly have placed an upper limit on the rate of growth, their direct impact may not have been large – as little as 0.33% according to a recent estimate by South African Reserve Bank (SARB) economists. In other words, the direct impact of load shedding was important but not decisive. However, it is likely that the indirect effects of the Eskom crisis became more salient, as the promise of a reliable electricity supply began to lose credibility. Confidence weakened, private-sector investments were postponed and government’s failure to resolve the crisis became an additional drag on efforts to revive the pace of growth.
Related to this was the impact of “state capture”. The increasing incoherence of policy was partly the consequence of deliberate efforts to repurpose the state and redistribute rents.[16] This retarded the efficiency of public investment, undermined tax collection by disrupting the revenue authority, and destabilised efforts to resolve the electricity supply constraint. From 2015, South Africa fell behind even the dismal performance of its global peers. This second blow to growth took place in the face of improving terms of trade.
From an aggregate demand perspective, several factors coalesced to shift the economy into an even lower gear.
- Falling export growth: For decades, South Africa’s export performance has been deteriorating. After 2012, the European Union shifted to current account surplus, rebalancing global trade.[17] EU efforts at austerity gained momentum after 2015 and this might have had an impact on South Africa’s exports.
- Tightening macroeconomic policy in 2015: Fiscal policy tightened and government consumption spending slowed. At the same time, South Africa’s sovereign risk spread widened, prompting a percentage point increase in the central bank’s policy rate. The dangers of macroeconomic tightening were well known at the time, with even the IMF advising authorities that “debt sustainability is essential, but further adjustments need to be carefully designed to avoid pressuring an already-weak economy”. [18]
- The most significant factor in the slowdown appears to be the contraction in domestic investmentafter 2015. This was led by the private sector and was most pronounced in mining. But the investment slowdown was broader. Capital formation also began to contract in the secondary and tertiary sectors, as business optimism and public confidence in the direction of the country fell to their lowest levels since the democratic transition. This was followed in short order by a sharp slowdown in public investment. In this case, the impact of poor project management, slow demand growth, and the policy chaos associated with state capture took their toll.
Figure 7: Gross fixed capital formation
This second blow to growth meant a further significant deterioration in South Africa’s fiscal prospects. An unusual period of elevated tax buoyancy came to a sudden end. The rate of growth fell below the interest rate raising deep concerns about debt sustainability, while the primary deficit began to widen. As these fundamentals of fiscal sustainability were shifting, the demands for greater public subsidies for university students – the #FeesMustFall movement – found widespread sympathy, and were eventually accommodated in the budget. This even while an increased sovereign risk spread imposing tighter financial conditions on government. At the same time, the political crisis of government that had been building for a decade became increasingly acute.
Political transition
As the world economy faced the global financial crisis, South Africa was in the midst of a political transition to a new leadership within the governing ANC. This led to fundamental changes in the character of political authority and public administration, changes that impeded the ability of government to present a coherent response to South Africa’s weakening economic prospects.
The Mbeki administration had sought to centralise policy authority, but the Zuma administration that emerged from the contestation in Polokwane was built on a fragmented coalition. The conference outcome reflected brokering by provincial party elites who were able to mobilise regional and branch bureaucracies behind their chosen slate. Mbeki had steadfastly refused to offer them the keys to government office.[19] Aggrieved, they delivered Zuma victory on the back of a broad coalition of forces hitherto excluded from influence over state policy. Left-wing activists within the ANC, the leadership of public sector unions, small black business lobbies, traditional leaders, popular churches, and small-town elites coalesced around Jacob Zuma. His authority was built on a popular coalition that reflected the fragmentation of South African politics and the elevation of provincial and local elites over national actors.[20] It also meant a more assertive and determined approach to the distribution of public sector rents and a state-centred approach to development.[21]
Once in office after 2009, the new coalition prioritised reform of “the macro structure of government”[22]. The political executive of government was expanded, while departments and agencies proliferated, resulting in a functionally overstretched and splintered state machinery.[23] National Treasury had to share macroeconomic policy authority with new departments, while planning functions were separated from budgeting and moved into the Presidency. As fiscal resources began to tighten and new demands were placed on the policy agenda, the managerial capabilities of civil service were thrown into disarray.
The Polokwane coalition also shifted policy authority away from state processes towards ANC party structures. It was widely felt that the latter had been “weakened in the policy making process, which takes place largely in government structures [..] [where] ministers rely on the expertise of technocrats”. A case in point was GEAR: “…set up in the dark by a small committee of experts working under […] [Thabo Mbeki] and presented as non-negotiable”.[24]
But choices can be made in the dark in various locations. The Constitution imposed clear rules of accountability, transparency and procedure on state structures, but the committees of the ANC could operate in relative obscurity, widening the scope for rent-seeking and weakening the capacity of government to articulate a coherent policy agenda. As political appointees asserted their control over the state, the turnover of personnel at the most senior level of the public service reached alarming levels: 172 people occupied the position of director-general in 38 national departments between 2009 and 2017. [25]
The basis for this weakening of the state and the elevation of party-political structures over government had been laid long before Polokwane. By the time of the transition, crude instrumentalist theories of state power, rooted in Soviet Marxism, were well entrenched in the ANC. The Public Service Act of 1994 had subordinated civil servants to political appointees. The ANC established the practice of “cadre deployment”, through which technical and professional appointments to the civil service and public enterprises emerged from opaque political consultations. The Mbeki administration built on this foundation, clipping wings of the independent Public Service Commission to facilitate political appointments[26], while Mbeki’s AIDS-denialism effectively weakened the legitimacy of scientific knowledge and technical expertise as a basis for public policy choices.
After the 2009 election, a single party continued to preside over government, but policy increasingly reflected the fragmented dynamics usually associated with coalition governments, including their well-known inability to resolve policy contradictions, restrain budget deficits and execute effective fiscal programmes.[27]Paradoxically, while disrupting and weakening government, the Polokwane moment signalled a more assertive, expansive, and state-centred approach to social and economic transformation, captured in the idea of a “second transition”.[28] An important ANC policy document of the time – State Intervention in the Minerals Sector (SIMS) – stated:
‘Since 2002 there has been unprecedented demand for minerals due to the Asian boom, which has resulted in historically high mineral prices. It also appears that this “super‐cycle” may continue for another two or three decades… However, due to transport and energy constraints, South Africa has not been able to fully take advantage of the high prices for iron ore, manganese ore, coal and ferro‐alloys, stimulated by the boom... These bottlenecks need to be resolved in order to grow employment. The robust demand for our resources puts us in a strong position to maximise their developmental impact, especially if put out to public tender against developmental objectives (job creation).’ [29]
The document added that “under the current fiscal regime our nation is clearly not getting a fair share of the resource rents generated from its mineral assets”, and proposed to correct this with a resource rent tax on the mineral sector, which it claimed would generate R40 billion or about 1.2% of GDP in annual revenue.
Government did not adopt the proposal for a resource rent tax (although a royalty tax had been introduced on mining and petroleum resources in 2008), but the SIMS document highlights three assumptions entrenched in policy thinking at the time. First, it was believed that the commodity boom would continue, or that a restored momentum of global growth would ease South Africa’s situation. The view that the world economy would recover strongly from the global crisis was mistakenly but widely held for years after 2008, including by the International Monetary Fund. Second, it was (and still is) generally accepted that infrastructure shortfalls were a binding constraint which, if addressed with public investment, would unshackle South Africa from its weak growth performance. Third, it was thought that the fiscal regime could be easily adjusted to realise greater resources for public interventions, without imposing additional taxation on affluent households. These three assumptions contributed to complacency about the fiscal challenges of sustaining the progressive realisation of socio and economic rights.
In 2012, government adopted the National Development Plan (NDP), which recognised that global economic growth was likely to be lower in the decade ahead. The NDP proposed a growth target of 5%, suggesting this could be achieved by growing exports, investing in economic infrastructure, and removing policy constraints to expansion. On this basis, the plan committed government to an ambitious policy agenda, including a large extension of post-school education, a universal health insurance scheme, and the provision of income support for the unemployed through public works. However, the NDP offered no fiscal programme associated with these commitments, implicitly assuming that accelerated growth would solve the contradiction. Its expansive social policy agenda continues to define the government’s democratic mandate.
Subsequent policy work did little to resolve the problem. The White Paper on Post-school Education committed government to expand enrolments in universities and colleges from 3.6 million in 2014 to 9.2 million by 2030 (a 6% annual growth rate) and to increase the real value of public subsidies per student. It did not suggest how this would be funded, except to say these policies would be implemented “as resources become available”.[30]
Similarly, the White Paper on National Health Insurance reached no clear conclusion about funding, even though it projected that public health spending would increase from 4% to 6.2% of GDP.
The Minister of Finance summarised National Treasury’s approach as, “If we do not achieve growth, revenue will not increase. If revenue does not increase, expenditure cannot be expanded”.[31]
Conclusion
In essence, the contradiction between dwindling financial resources and an expansive policy agenda was left unresolved. In the next article we will examine how this core contradiction has been at the heart of the falling real value of public services, and, at the same time, an absence of fiscal consolidation.
References
African National Congress. 1994. The Reconstruction and Development Programme: A Policy Framework. Johannesburg: Umanyano Publications.
African National Congress. 2012a. State Intervention in the Minerals Sector: Maximizing the Developemntal Impact of the People’s Mineral Assets. ANC Policy Institute.
African National Congress. 2012b. ‘The Second Transition? Building a National Democratic Society and the Balance of Forces in 2012’.
Ajam, T: Public Finance and Fiscal Policy in South Africa; in Oqubay,A, Tregenna,F, and Valodia, I (eds):The Oxford Handbook of the South African Economy (Oxford University Press, 2021)
Ajam, T and Janine, A, 2007. ‘Fiscal Renaissance in a Democratic South Africa’. Journal of African Economies 16(5):745–81. doi: 10.1093/jae/ejm014.
Barron, Chris. 2020. ‘New Civil Service Key to New Dawn: Interview with Mavuso Msimang’. The Sunday Times, February 2.
Chabane, Collins. 2009. ‘Media Briefing by Minister Chabane on the Macro Structure of Government (Transcript) | Government Communication and Information System (GCIS)’. Retrieved 9 October 2020 (https://www.gcis.gov.za/content/newsroom/media-releases/media-briefings/...).
Chipkin, Ivor. 2016. ‘In Jacob Zuma, South Africa Has Found Its Gorbachev’. Daily Maverick. Retrieved 19 September 2020 (https://www.dailymaverick.co.za/opinionista/2016-07-31-in-jacob-zuma-sou...).
Chipkin, Ivor. 2019. ‘Provincial Elites Catapulted into the Cabinet Weaken State Capacity’. Business Day, February 22.
Chipkin, Ivor, Mark Swilling, Haroon Bhorat, Mbongiseni Buthelezi, and Sikhulekile Duma. 2018. Shadow State: The Politics of State Capture.
Darracq, Vincent. 2008. ‘Being a ‘Movement of the People’and a Governing Party: Study of the African National Congress Mass Character’. Journal of Southern African Studies 34(2):429–49.
Deaton, Angus. 1999. ‘Commodity Prices and Growth in Africa’. Journal of Economic Perspectives 13(3):23–40. doi: 10.1257/jep.13.3.23.
Frankel, Jeffrey, Ben Smit, and Frederico Sturzenegger. 2006. South Africa: Macroeconomic Challenges After a Decade of Success.
Fine, B, and Z. Rustomjee. 1996. ‘The Political Economy of South Africa: From Minerals-Energy Complex to Industrialisation C Hurst and Co’. Witwatersrand University Press.
Gelb, Stephen. 2004. ‘An Overview of the South African Economy’. in The State of the Nation (2004-2005). HSRC Press.
Gelb, Stephen. 2007. ‘The RDP, GEAR and All That: Reflections Ten Years Later’. Transformation: Critical Perspectives on Southern Africa62(1):1–8. doi: 10.1353/trn.2007.0004.
Hassen, Ebrahim-Khalil, and Miriam Altman. 2010. Public Service Employment and Job Creation in South Africa. Human Sciences Research Council.
Havemann, Roy, and Edward Kerby. 2020. Reigniting Economic Growth: Lessons from Three Centuries of Data
IMF. 2016. South Africa: Staff Report for the 2016 Article IV Consultation. International Monetary Fund
Kaplinsky, Raphael. 2010. ‘China, Commodity Prices and the Terms of Trade’. Pp. 91–111 in China and the World Economy, edited by D. Greenaway, C. Milner, and S. Yao. London: Palgrave Macmillan UK.
Makgetla, Neva. 2018. ‘South Africa’s Exports and Inclusive Industrialisation’.
Martin, Isaac William, Ajay K. Mehrotra, and Monica Prasad, eds. 2009. The New Fiscal Sociology: Taxation in Comparative and Historical Perspective. Cambridge ; New York: Cambridge University PressRepublic of South Africa. 1996. ‘Growth, Employment and Redistirbution: A Macroeconomic Strategy’.
Naidoo, Vinothan. 2019. ‘Transitional Politics and Machinery of Government Change in South Africa’. Journal of Southern African Studies45(3):575–95. doi: 10.1080/03057070.2019.1622309.
Nene, Nhlanhla. 2015. ‘Speech on the Tabling of the Medium Term Budget Policy Statement’.
Perotti, Roberto, and Yianos Kontopoulos. 2002. ‘Fragmented Fiscal Policy’. Journal of Public Economics 86(2):191–222. doi: 10.1016/S0047-2727(01)00146-3.
Republic of South Africa. 2013. ‘White Paper for Post-School Education and Training: Buidlling and Expanded, Effective and Integrated Post-School System (as Approved by CAbinet on 20 November 2013)’.
Roubini, Nouriel, and Jeffrey Sachs. 1989. Government Spending and Budget Deficits in the Industrial Economies. Working Paper. 2919. National Bureau of Economic Research
Von Holdt, Karl. 2019. ‘The Political Economy of Corruption: Elite Formation, Factions and Violence’. Society, Work & Politics Institute Working Paper 2019(10).
Van Onselen, Gareth. 2017. Political Musical Chairs: Turnover in the National Executive and Administration Since 2009. South African Institute of Race Relations
[1] The full paper can be found on www.wits.ac.za/scis
[2] Ajam and Janine, 2007
[3] Quoted in Martin et al, 2009
[4] African National Congress, 1994. Emphasis added.
[5] Gelb, S 2004
[6] Gelb, S (2007)
[7] Republic of SA, 1996
[8] Hassen and Altman, 2010
[9] Ajam, 2021
[10] Frankel et al, 2006
[11] Klein and Pettis, 2020
[12] Havemann and Kerby, 2020
[13] Kaplinsky, 2010
[14] Fine and Rustomjee, 1996
[15] Makgetla, 2018 and Deaton, 1999.
[16] Chipkin et al, 2018
[17] Klein and Pettis, 2020
[18] IMF, 2016; 1
[19] Darracq, 2008
[20] Chipkin, 2016; 2019
[21] Van Holdt, 2019
[22] See Chabane, 2009
[23] Naidoo, 2019
[24] Darracq, 2008.
[25] Van Onselen, 2017
[26] Msimang cited in Barron, 2020
[27] Roubini and Sachs, 1989; Perotti & Kontopoulos, 2002
[28] ANC, 2012b
[29] ANC, 2012a: emphasis added
[30] RSA, 2013
[31] Nene, 2015
Download article
Post a commentary
This comment facility is intended for considered commentaries to stimulate substantive debate. Comments may be screened by an editor before they appear online. To comment one must be registered and logged in.
This comment facility is intended for considered commentaries to stimulate substantive debate. Comments may be screened by an editor before they appear online. Please view "Submitting a commentary" for more information.