Poverty may have declined, but women and female-headed households still suffer most
Introduction
A number of recent studies have reported a decline in poverty rates in South Africa since 2000. At the same time, new ways in which to assess well-being have been developed to complement the income-based measures of poverty. One of these is the Multidimensional Poverty Index, or MPI, which looks at attainment, or deprivation, in dimensions of education, health and living standards rather than in terms of income. The MPI has provided rich insights into poverty trends in South Africa. (See the July 2013 Econ3x3 article of Finn et al., who found that the decline in multidimensional poverty since 1993 has been much greater than the decline in poverty as measured in terms of income).
A pertinent question regarding the observed decline in poverty in the late 1990s and mid- 2000s is whether there still are gender differences in the risk of poverty. In other words, what do we know about the poverty status of women relative to men? A similar question applies to households: do female-headed households face different risks of poverty than male-headed households?
In analysing these questions, it may be important to view them through a multidimensional lens to complement the income-based approach; the former also potentially carries more direct implications for policy.
This article presents result from both an income-based and a multidimensional approach to measuring the gender poverty gap in South Africa (see also Posel & Rogan 2009, 2012; Rogan 2013). It considers poverty gaps between individual women and men as well as between female- and male-headed households.
The findings confirm that there is a large gender poverty gap in terms of income: women tend to be up to 30% poorer than men. At the household level, there is an even larger poverty gap: households headed by women are between 38% and more than 100% poorer than households headed by men (depending on the measure used). The data used is from the 2008 NIDS (National Income Dynamics Study), one of the few sources of data in South Africa which can be used to analyse both income poverty and multidimensional poverty.
Gender differences in income-based poverty
To measure income poverty, I estimated headcount ratios, i.e. the proportion of the population that is below a specified poverty line. Poverty lines are defined in terms of per capita monthly household income. Statistics South Africa has identified three national poverty lines: an upper-bound poverty line of R577 household income per person per month, a lower-bound poverty line (R416), and a food poverty line (R305), all expressed in terms of prices as they were in 2008.
For comparative purposes, this article also presents a poverty line which yields a poverty headcount similar to that of the MPI. Because the MPI poverty headcount ratio is expected to be substantially lower than the headcounts from these poverty lines,[1] this MPI-equivalent poverty line is calculated as R142, which is less than half the food poverty line. (It is only used for comparative purposes, not to indicate a level below which an individual is poor).[2]
The left-hand side of table 1 presents poverty headcount ratios for the four different poverty lines for individuals aged 15 years and older. Consider the first column: for the upper-bound poverty line of R577, the income-based poverty rate for women (57%) is significantly higher than that for men (46%). The difference between these poverty rates, as measured by the gender poverty ratio of 1.23, is 23%. For lower poverty lines the poverty headcount decreases for both men and women, but the size of the gender poverty ratio actually increases: amongst the very poor, the women are even worse off than men in terms of income poverty.
Table 1. Gender differences in income poverty headcount
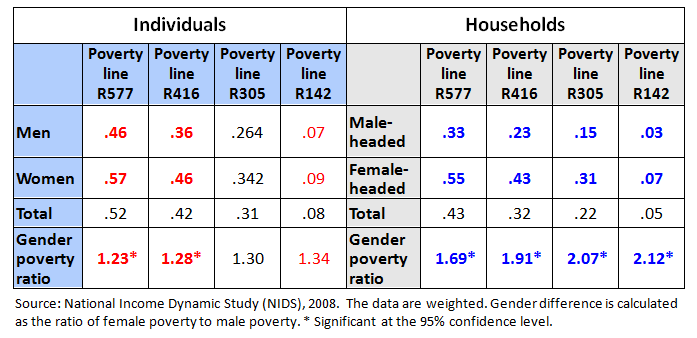
The table also shows the headcount rates at the household level. In line with the existing work on gender and poverty in South Africa, the difference in income poverty rates between female- and male-headed households is considerably larger than the difference between individual women and men. At the two higher poverty lines, the gender-related poverty gap between the two household types is 69% and 91% respectively. At the two lower poverty lines (the food-poverty and MPI-equivalent poverty lines), female-headed households are more than twice as likely to be poor than male-headed households. This is evidence of a huge gender gap with regard to poverty.
Gender differences in multidimensional poverty: using the MPI
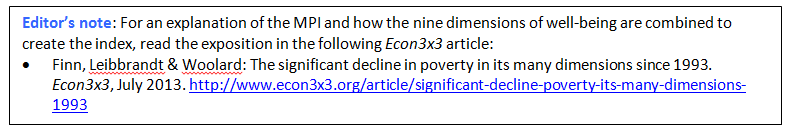
Table 2 shows the results for the MPI approach. In comparing the risks of multidimensional poverty faced by women versus men (and female- versus male-headed households), the most direct measure is the headcount (H).
Since only 8% of all adult South Africans are identified as living in a household that is multidimensionally poor,[3] the MPI headcount rate is far lower than headcount rates calculated from the national poverty lines (Table 1). But that is not the point here. What is important is that the gender difference in the rate of multidimensional poverty for individuals is significant and at about 29% (compare a count of 0.089 relative to one of 0.069 – the red numbers in the first column of table 2).
Table 2. Gender differences in MPI poverty measures
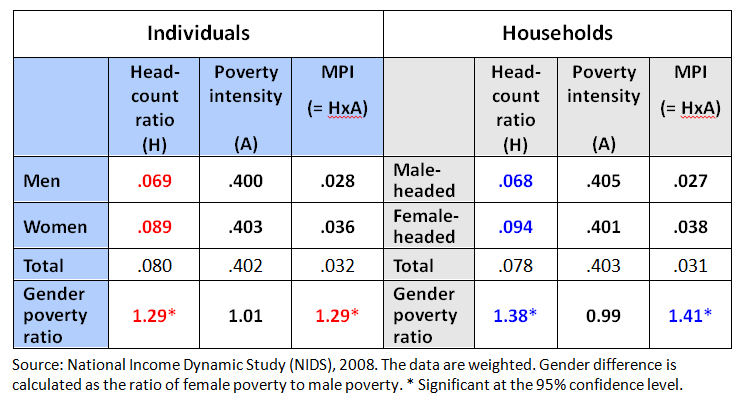
The second MPI measure is A, the average intensity of poverty. It is calculated as the average proportion of the nine indicators in which poor people are deprived. Column 2 of table 2 shows that multidimensionally poor women and men are deprived in about the same fraction (about 40%) of the components of the MPI. Since this is so, the gender difference in the MPI itself is also about 29% (column 3).
At the household level, female-headed households are significantly more likely to be multidimensionally poor than male-headed households (9.4% and 6.8% respectively – the blue numbers in the 4th column). The gender difference in the rate of multidimensional poverty of households is significant at about 38-40% (blue numbers in the bottom row).
All in all, the MPI analysis confirms the existence of a large, and statistically significant, gender poverty gap: women are significantly worse off than men, and female-headed households are significantly worse off than male-headed households – despite overall poverty being much lower in 2008 than in 1993.
A last step is to compare the gender gaps for the income-based measures of poverty and the MPI-based measures. For individuals, the gender gap for MPI poverty (29%) is similar to that for income poverty (23%-34% for various poverty lines, including the MPI-equivalent poverty line).
However, for household-headship, the gender gap for MPI poverty (38%-40%) is considerably smaller than the gender gap for income poverty (approximately 70%-110%). Therefore, for multidimensional poverty the risk for female-headed households is much closer to the risk for male-headed households than is the case for income poverty.
The gender profile of multidimensional deprivation
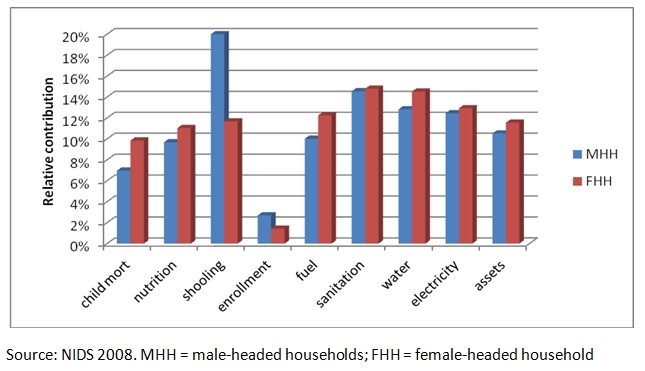
Why are there such gender differences in multidimensional poverty? Figure 1 shows the relative contribution of each component of the MPI to the MPI value for men and women. The two largest contributors to female multidimensional poverty in South Africa are child mortality and nutrition, followed by a lack of sanitation and clean water.
Figure 1. Relative contribution to MPI-poverty for men and women
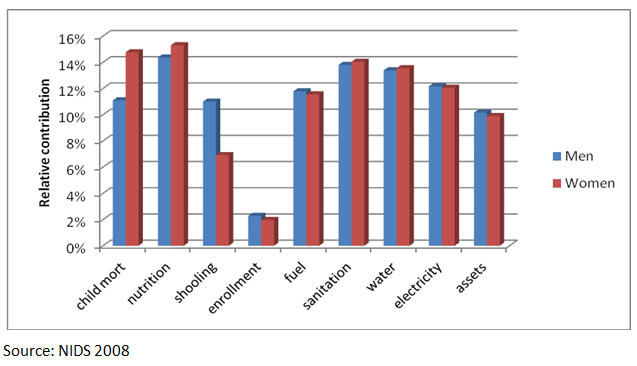
The shape of multidimensional poverty is slightly different for men. For adult men, the main contributor to MPI poverty also is nutrition. The notable aspects of male deprivation, relative to those of women, are the relatively greater contribution of an inadequate education among adult householders, and also the considerably smaller contribution of child mortality. (There appears to be very little difference in the contribution of children’s school enrolment, even though men are less likely to live in households with children).
As far as female- and male-headed households are concerned, the sources of deprivation are also somewhat different (see figure 2).
Figure 2. Relative contribution to MPI-poverty by gender of household head
Child mortality, poor nutrition and a lack of access to water and clean cooking fuels contribute more to poverty in female-headed households than in male-headed households. Some of these deprivations (e.g. poor access to water, cooking fuels and electricity) possibly reflect the greater likelihood of female-headed households’ being located in rural areas.[4] Perhaps the biggest difference lies in education: low levels of adult schooling are a much larger source of poverty in male-headed households.
Conclusion
The evidence presented in this article confirms that there is a large poverty gap between men and women in South Africa. Women tend to be up to 30% poorer than men. This finding does not depend on the measure used: the multidimensional gender poverty gap is very similar to the poverty gap measured by the conventional income approach. An even larger poverty differential exists between female- and male-headed households: from 40% for the MPI to more than 100% for income.
While investments in education, health and basic services in the post-apartheid period have undoubtedly improved the lives of millions of South Africans, significant gender differences in levels of human development persist. Women and people living in female-headed households still suffer most.
Given the scale of the government’s investments in social services, one would expect that gender differences in acute multidimensional poverty would be smaller than in income poverty. Indeed, for female-headed households (relative to male-headed households) this seems to be the case. There are two possible explanations for this being so. First, better access to social services like education, health, sanitation, water and energy – despite a relative lack of (male) labour-market income, for example – appears to be an important cause of the smaller MPI-poverty gap. A second (somewhat tentative) explanation is that women may achieve better outcomes when they have control over household decision-making, e.g. over schooling and enrolment.
For individuals the picture is different. The finding that the gender gap for multidimensional deprivation (in health, education and other services) is as large as the gap for income poverty at least suggests that, on an individual level, gender inequality goes beyond income to include key aspects of living standards and social services.
But why does the gender gap in multidimensional poverty persist – whether on the individual or the household level? One answer is that risks of poverty for women due to disadvantages in the labour market carry over to – or at least are not separable from – their higher risks of multidimensional poverty. In addition, women’s greater responsibilities for the care of children mean, for example, that South Africa’s high mortality rate for children under five years of age affects affect women more than men.
Clear policy implications emerge from a gender perspective on poverty. Investments in specific health care services to prevent mother-to-child transmission of HIV, and the improved delivery of clean water and sanitation in rural areas have would have large benefits for women in particular and are likely to yield significant progress towards gender equality.
References
Alkire S. & Santos M.E. (2010). Acute Multidimensional Poverty: A New Index for Developing Countries. OPHI Working Paper No. 38. University of Oxford.
Casale D. & Posel D. (2002). The Continued Feminisation of the Labour Force in South Africa: An Analysis of Recent Data and Trends. The South African Journal of Economics
70 (1): 156-184.
Finn A., Leibbrandt M. & Woolard I. 2013. The significant decline in poverty in its many dimensions since 1993. Econ3x3, July 2013.
Posel D. & Rogan M. (2009). Women, Income and Poverty: Gendered Access to Resources in Post-Apartheid South Africa. Agenda 23 (81): 25-34.
Posel D. & Rogan M. (2012). Gendered Trends in Poverty in the Post-Apartheid Period, 1997–2006. Development Southern Africa 29 (1): 97-113.
Rogan M. (2013). Poverty and Headship in Post-Apartheid South Africa, 1997-2006. Social Indicators Research 113 (1): 491-511.
[1] The MPI headcount is expected to be far lower than poverty headcounts at South Africa’s official poverty lines because it was designed as a measure of ‘acute’ deprivation. As such, the cut-offs assigned for each indicator denote ‘deprivations in very rudimentary services and core human functionings’ (Alkire & Santos 2010: 7).
[2] The food poverty line is calculated as the minimum level at which an individual could survive in terms of caloric intake. The equivalent money-metric line of R142 is therefore well below even the lowest possible poverty line that is used in the South African context. However, because the analysis is concerned with gender differences in well-being the equivalent line is used for comparison purposes only and is not intended to denote a particular level of resources at which an individual or household is considered poor.
[3] Individuals are poor if they live in a household which is deprived in more than a third of the weighted indicators identified; see Finn et al (2013).
[4] About 39% of all female-headed households live in rural areas, compared with about 30% of male-headed households. Moreover, a third of female-headed households lives in traditionally under-serviced former tribal areas while only 20% of male-headed households are located in these areas (own calculations from NIDS 2008).
Download article
Post a commentary
This comment facility is intended for considered commentaries to stimulate substantive debate. Comments may be screened by an editor before they appear online. To comment one must be registered and logged in.
This comment facility is intended for considered commentaries to stimulate substantive debate. Comments may be screened by an editor before they appear online. Please view "Submitting a commentary" for more information.
This is an interesting and
This is an interesting and useful contribution. It will be interesting to know how these gender gaps have changed over the post-apartheid period; especially as the article starts out by flagging the declines in money-metric and multidimensional poverty. Have these gaps declined along with the declines in the aggregate indices? The gaps may have increased; indicating that the declines in aggregate poverty have benefitted the males more than females. It seems to me that it is important for us to know how this has gone.
I think this would be an
I think this would be an interesting question. The 1993 PSLSD could be used as the baseline year for the measure over time. Unfortunately there is nothing (reliable) in between from which one could estimate the MPI. One the one hand, one could imagine that the gender gap in human poverty has narrowed (particularly given the role of social grants in the 2000s) but, on the other, it is possible that service delivery has benefitted men more than women (or vice versa- see Dinkelman 2011). The most important factor, however, could quite possibly be the extent to which the burden of under-5 mortality has disproportionately affected women (relative to men) over time. One suspects that the impact of the HIV/AIDS epidemic (particularly between the late 1990s and mid-2000s) would be important here.