The significant decline in poverty in its many dimensions since 1993
Introduction
Studies measuring trends in poverty and inequality often use measures of people’s income and/or expenditure to represent their well-being. While such measurements in terms of monetary values – ‘money-metric measures’ – are important and useful, there is a general recognition that they need to be complemented by examining changes in the dimensions of well-being that cannot be measured in monetary terms. Indeed, it is striking that, when the poor are asked to characterise what it means to be poor, they use phrases such as the following: isolation from the community, a lack of security, low wages, a lack of jobs, poor nutrition, little access to water, and poor educational opportunities.[1] Clearly, being poor is not just a question of not having enough income or wealth – the well-being of the poor is determined by several other aspects of their lives.
These insights are important if we are to gain a better understanding of poverty or make a difference in fighting poverty. Indices that measure other dimensions of poverty are likely to inform more focused policy making. For example, a province in which most poor people are deprived with regard to education will require a different strategy for poverty reduction from that in a province in which most people are deprived with regard to housing.
The results of using such multidimensional indices to measure poverty can be striking. Using data that covers the post-apartheid period, we implement an approach that moves away from money-metric measures and considers well-being as consisting of a combination of education, health and living standards. Our findings show that multidimensional poverty has declined significantly since 1993, and that this decline is markedly larger than the decline in money-metric poverty over the same period.
The elements of the Multidimensional Poverty Index (MPI)
Our findings are based on an application of the Multidimensional Poverty Index approach, using data from national household surveys.[2] The MPI that we calculated for South Africa has three dimensions, related to nine indicators, as shown in Figure 1. Each dimension carries equal weight and each indicator within a dimension is also equally weighted (weights are shown in brackets below). Note that income does not feature as any part of the index.
Figure 1: The composition of the Multidimensional Poverty Index
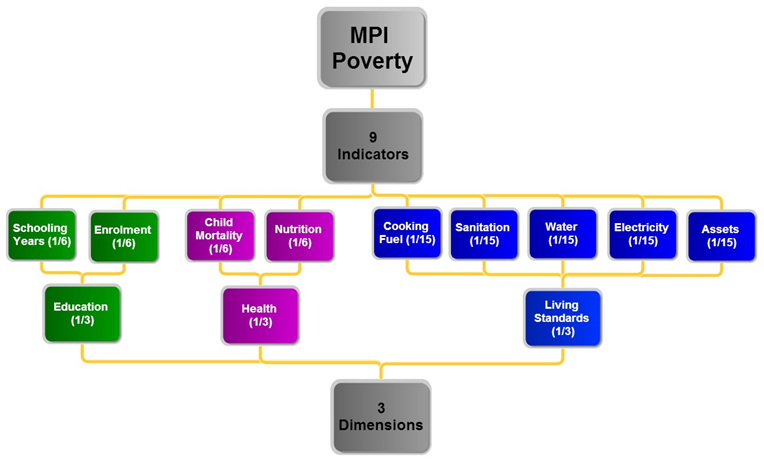
Each indicator has its own threshold which determines whether a household is deprived in that particular area.[3] For example, a household is classified as deprived in terms of schooling years if no household member has at least five years of education, and in enrolment if one child of school-going age does not go to school; water deprivation is defined as not having piped water on site; deprivation in child mortality is indicated by a child having died before age 15 and in nutritional deprivation by one person in the household being seriously underweight (see Finn et al 2013 for the formal definitions).
For each household, a value can be calculated for each of the nine indicators, using the relevant data from the two surveys. This value indicates the level of attainment or access in that dimension. Every individual in the household is given the same MPI score, which enables analysis at the individual level. If a person has a value below an indicator’s threshold value, it means that person is ‘deprived’ in that particular indicator (e.g. access to water).
The calculation of the MPI involves two components. First, we calculate the multidimensional poverty headcount ratio, denoted as H, as the proportion of the population that is multidimensionally poor. Therefore, H indicates the incidence, or prevalence, of poverty. Anyone who is deprived in more than three (one third) of the indicators is included in the headcount. Secondly, we calculate the average proportion of the nine indicators in which poor people are deprived, denoted as A, which indicates the average intensity of poverty. These two measures (H and A) individually allow very interesting interpretations of trends, as discussed below.
The MPI itself is calculated by multiplying the multidimensional poverty headcount ratio by the average intensity of poverty: MPI = H x A. The MPI has no intuitive interpretation, but changes in its value over time are relevant.
In order to compare the changes in multidimensional and money-metric poverty more easily, a money-metric poverty headcount is also reported below. The money-metric poverty headcount ratio was calibrated so that its starting value (in 1993) is the same as that of the multidimensional poverty headcount, i.e. 0.37.[4]
The trend in poverty: comparing multidimensional and money-metric results
Table 1 depicts and compares multidimensional and money-metric poverty in South Africa in 1993 and 2010. We first consider the former. The first column – the multidimensional headcount ratio – shows that 37% of the population was multidimensionally poor in 1993. This amounted to approximately 14.5 million people. By 2010 the ratio had fallen to 8%. This means that by 2010, only 8% of the population, or approximately 4 million people, were deprived in more than three of the nine areas of multidimensional poverty.[5]
Table 1: Comparing poverty measures for South Africa for 1993 and 2010
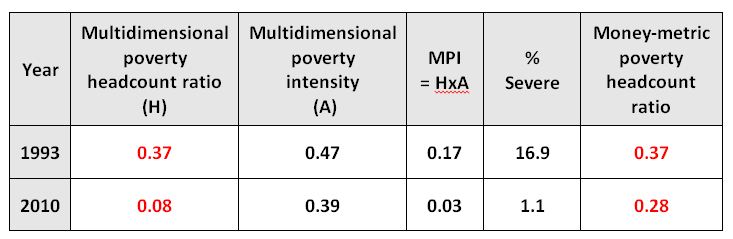
Source: Own calculations using weighted PSLSD (1993) and weighted NIDS wave 2 (2010-2011).
The second column shows that, in addition, the average intensity of poverty among the poor (A) fell from 47% of the nine indicators in 1993 to below 40% in 2010. This means that the 8% who remained multidimensionally poor in 2010 were deprived in fewer dimensions of poverty than in 1993: roughly, in four areas instead of five (on average).
When the changes in H and A are taken together, they indicate that in 2010 there were significantly fewer multidimensionally poor people; and that those who were still poor, were somewhat less poor than in 1993.
The value of the MPI = H x A captures this combined change. As seen in column 3 of table 1, the MPI value dropped from 0.17 in 1993 to 0.03 in 2010 – a huge decline in overall multidimensional poverty. The decline in MPI was mainly due to a significant fall in the MPI headcount ratio H. (The sources of the decline are discussed below.
Extending the analysis a little further, severe poverty can be defined as being deprived in 50% or more of the indicators. Here there was a sizeable decline in the proportion of the population in severe poverty. Whereas in 1993 close to 17% of the population was severely multidimensionally poor, this fell to just over 1% in 2010 (column 4 of table 1). This is a remarkable result.
The final column of table 1 presents the money-metric headcount ratios for 1993 and 2010. When we compare changes in the two headcount ratios from 1993 to 2010, it appears that the national incidence of multidimensional poverty fell from 37% to 8% (column 1), while the decline in the incidence of money-metric poverty over the period was much smaller: from 37% to 28%.
Together the multidimensional poverty figures imply that, if a broader view is taken of poverty as a multidimensional phenomenon that includes crucial non-monetary elements of well-being, there has been a huge drop in multidimensional poverty – in absolute terms and when compared to money-metric poverty.
Sources of the decline in multidimensional poverty
Figure 2 provides a graphical illustration of the main causes of the decline in multidimensional poverty in the population over time. Half of the population was classified as water deprived in 1993. By 2010 this had halved. The gains in sanitation were more modest, with a 10 percentage point fall being recorded: from 57% to 47%. Electricity deprivation fell substantially in the period under study. In 1993 more than half the population lived in a dwelling without electricity. By 2010 this had fallen to one fifth. The health dimension saw a fall in mortality deprivation in the population from 21% to 9% and there was a fall in nutritional deprivation from 11% to 3%.
Figure 2: Sources of deprivation among the population
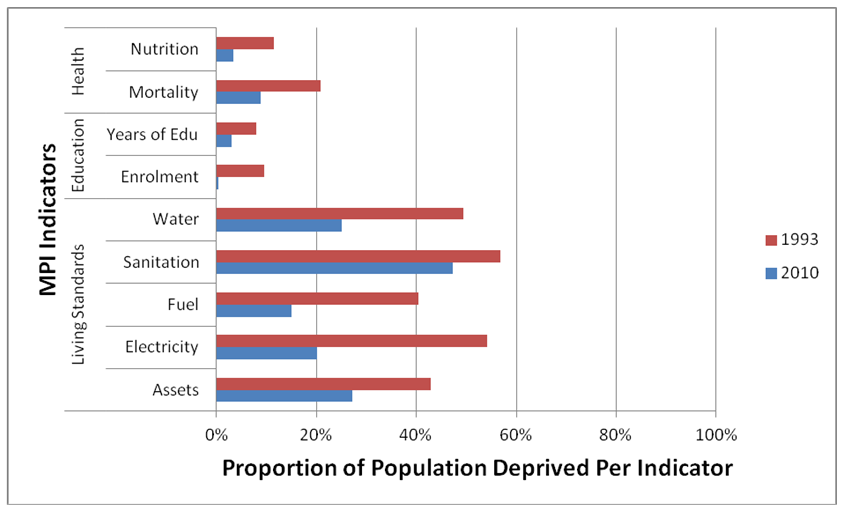
Source: Own calculations using weighted PSLSD (1993) and weighted NIDS wave 2 (2010-2011).
The area with the biggest improvement was school enrolment, where the deprivation indicator declined to almost zero in 2010. The dramatic improvement in this education indicator was a major factor behind the decline in multidimensional poverty since 1993.
The texture of poverty: the evolution of the MPI indicators
A look at the nine individual MPI indicators reveals interesting patterns. Figure 3 shows where deprivation was most concentrated among those who were multidimensionally poor (i.e. not among the population as a whole). In 1993, water, sanitation and electricity were the three indicators in which the multidimensionally poor were most deprived – more than 80% of the multidimensionally poor were deprived in these areas. In 2010 sanitation and water remained as the two areas of greatest deprivation, with asset deprivation moving into third place, now also above 80%. On the whole, the living standards dimension remains the main source of deprivation.
Figure 3: Main areas of deprivation among the multidimensionally poor
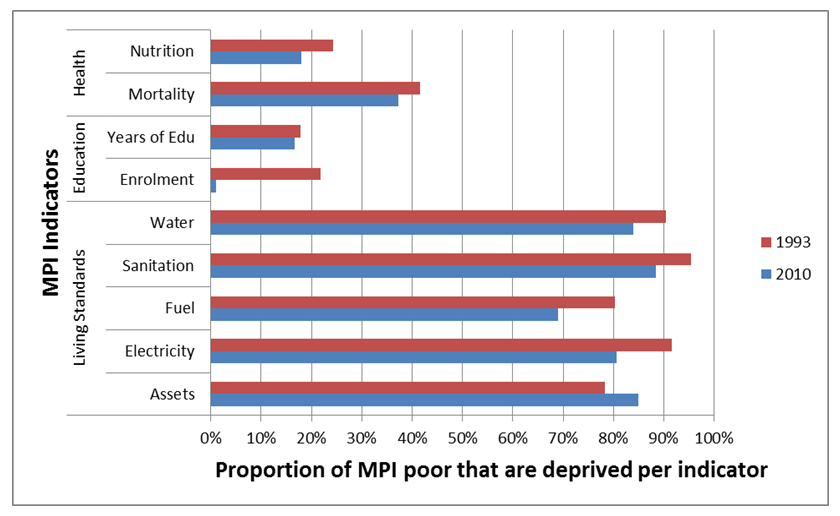
Source: Own calculations using weighted PSLSD (1993) and weighted NIDS wave 2 (2010-2011).
The only indicator to show an increase in deprivation amongst the poor was household assets (relating to ownership of a vehicle, TV, cell phone and fridge, etc.), where the deprivation rate of those that are multidimensionally poor increased from 78% in 1993 to 85% in 2010/2011.[6] This was largely due to the fact that in 2010/11 a lower proportion of multidimensionally poor households reported owning a vehicle of some kind than in 1993.
Conclusion
Between 1993 and 2010 the reduction in multidimensional poverty was significant and notably higher than the concomitant fall in money-metric poverty. Thus, significant increases in public expenditure to attain universal school enrolment, to reduce child mortality and expand access to services such as electricity and sanitation to poor communities have been very effective in reducing multidimensional poverty.
As a consequence, one would have expected many of those trying to enter the contemporary labour market to do so with better levels of education and health than in 1993 and coming from households that are better off in terms of water, electricity and assets.
This should mean that many job seekers should face fewer, or lower, poverty-related barriers in searching for and finding jobs. However, a significant increase in employment has not occurred. The labour market has not functioned in a way that has turned this enhanced potential into large-scale increases in productive employment. As confirmed by the relatively small decline in the money-metric poverty headcount ratio, the multidimensional improvements have not translated into notably higher real earnings for the poorer segments of South African society. This means that the country has not garnered full social and economic returns from the considerable achievements in the reduction of multidimensional poverty over the post-apartheid period. The puzzle of persistently high unemployment remains.
References
Alkire, S. & Foster, J. (2011) Counting and Multidimensional Poverty Measurement. Journal of Public Economics, 95(7).
Alkire, S., Roche, J., Santos, M. & Seth, S. (2011) Oxford Poverty and Human Development Initiative: South Africa Country Briefing. Oxford.
Finn, A., Leibbrandt, M. & Woolard, I. (2013). What happened to multidimensional poverty in South Africa between 1993 and 2010? SALDRU working paper 99, University of Cape Town.
May, J. (1998) Poverty and Inequality in South Africa. Indicator, 15(2).
SALDRU (Southern Africa Labour and Development Research Unit) (1995) Project for Statistics on Living Standards and Development (PSLSD) [dataset]. Version 2. Cape Town: SALDRU [producer], 1995 and DataFirst [distributor], 2010.
--------- (2012) National Income Dynamics Study (2010-2011), Wave 2 [dataset]. Version 1. Cape Town: SALDRU [producer] and DataFirst [distributor], 2012.
[1] These are examples from the South African Participatory Poverty Assessment; see May (1998)
[2] A detailed explanation of the methodology behind the construction of the MPI is contained in Alkire and Foster (2011). We use data from the Project for Statistics on Living Standards and Development (PSLSD) and the National Income Dynamics Study (NIDS) Wave 2 datasets (SALDRU, 1995, 2012).
[3] Our thresholds for the various dimensions are in line with those used in Alkire et al (2011).
[4] This means the money-metric poverty line was chosen so that 37% of the population fell below it in 1993. This is R292 household monthly income per capita measured in 2010 Rands. (The amount is held constant in real terms so that we can see the difference in poverty reduction between the two measures.) Therefore, by construction the national headcount ratio for money-metric poverty matches the multidimensional poverty headcount ratio of 37% in 1993.
[5] In 1993 the South African population was approximately 39.5 million; in 2010 it was approximately 50 million.
[6] It is important to note that this is only for the multidimensionally poor. In the population at large, the proportion deprived in this indicator decreased from 43% to 27% over the period.
Download article
Post a commentary
This comment facility is intended for considered commentaries to stimulate substantive debate. Comments may be screened by an editor before they appear online. To comment one must be registered and logged in.
This comment facility is intended for considered commentaries to stimulate substantive debate. Comments may be screened by an editor before they appear online. Please view "Submitting a commentary" for more information.