What has happened to the personal income tax base since 2011?
Introduction
Personal income tax is the primary revenue source in South Africa’s fiscal system. Its buoyancy in the context of slow and declining economic growth over the past 13 years has resulted in part from an increase in taxable income as a share of GDP, but also from tax-raising policy measures and shifts in the distribution towards higher-income taxpayers.
The proportion of individuals reporting income above the tax threshold has increased from 45.6% in 2011 to 51.0% in 2023. The percentage of taxpayers and of taxable income in the top marginal tax brackets has also increased. Though the PIT tax base has continued to grow since 2017, the increase in both taxpayer numbers and taxable income has been markedly slower than in the earlier period.
Buoyant PIT revenue, despite weak economic growth
The 2023 Medium Term Budget Policy Statement has again raised the official personal income tax (PIT) revenue estimate for the current year, alongside downward revisions to the other main tax sources.
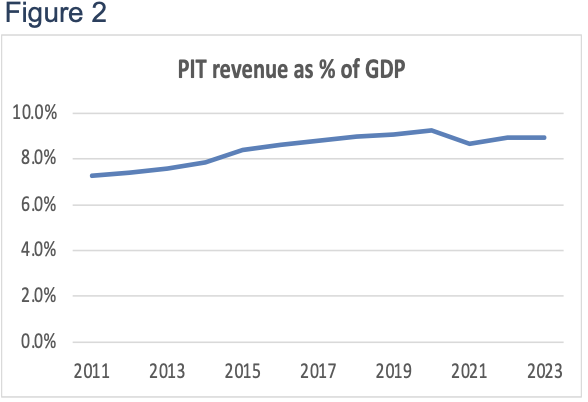
Over the 2011 – 2023 period,[1] PIT revenue increased from 33.7% of gross tax revenue to 35.6%, and in the MTBPSit is projected to rise to 37.4% in 2023/24.[2] PIT revenue increased from 7.3% of GDP in 2010/11 to 9.2% in 2019/20, declined to 8.7% in the Covid-affected 2021 fiscal year and recovered to 8.9% of GDP over the subsequent two years.
Drawing on the Individual Income Panel held in the National Treasury / SARS Tax Datalab for the 2011 – 2018 years and on a summarised tabulation of PIT tax data provided by SARS for the 2017 – 2023 years,[3] this paper provides estimates of the trend in the size and distribution of the personal income tax base over the 13 years to 2023. The analysis suggests that about a quarter of the increase in PIT revenue as a share of GDP in the period to 2020 is accounted for by the buoyancy of taxable income relative to national output. Shifts in the distribution of income together with revenue-raising policy measures account for the greater part of the rising PIT tax burden.
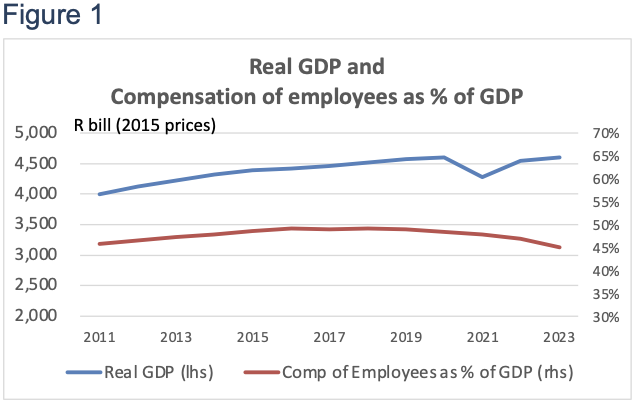
The increase in PIT revenue as a percentage of GDP is illustrated in Figure 2, against the background of slow and declining growth in GDP and the apparent decline in compensation of employees as a share of GDP illustrated in Figure 1. The severe impact of the Covid-related economic shock in 2020 is clear – not only was there a sharp decline in GDP, but PIT revenue as a percentage of GDP also fell.
Taxable income – what does it measure?
The personal income tax system relies largely on statutory returns by employers, retirement funds, medical schemes, and financial institutions. Those earning more than R500,000 a year or who meet other specified criteria are required to submit individual returns for assessment; however, for most people “final” tax liability is determined by information on income and deductions provided by employers. The personal income tax register contains some 25 million individuals, but many of these are inactive. The number of unique individuals for whom income is reported to SARS is currently around 15 million, including short-term or seasonal employees, pensioners and others who receive passive income only. The total is substantially higher than formal non-agricultural employment, estimated in the most recent QLFS as 11.6 million.[4]
An individual’s PIT liability is calculated in relation to “taxable income”, which excludes various categories of tax-exempt income and various deductions allowed under the Income Tax Act. These include donations to approved charitable organisations, travel expenses, subsistence allowances, and other business-related expenses. The largest category of deductions is contributions to retirement funds, as tax on this income is deferred until it is received through withdrawals or pension annuities.
In the analysis below, “taxable income” includes annuities received from retirement funds, but not lumpsum payments. These are taxed separately. Tax paid on lumpsum payments, which amounts to about 4.7% of PIT revenue, is therefore excluded from the estimates of “ordinary” PIT revenue used here. Adjustments are also made below for the tax expense associated with the employment tax incentive (ETI) which is recorded against PIT revenue in the tax statistics and amounts to between 1% and 1.5% of the total.[5]
For the self-employed, individuals who earn business income and claim associated expenses, and for others for whom employer-provided data is insufficient, such as individuals with disability-related expenses – tax liability is typically only finalised after the end of the tax-year and through completion and assessment by SARS of an ITR12 tax return. This return also serves to combine information provided to SARS by different sources – two or more employers perhaps, one or more retirement funds, financial institutions and medical schemes.
During the tax-year, SARS records taxpayer information – income, deductions, and PAYE paid – derived from tax certificates from employers or other institutions. Subsequently, an administrative dataset is compiled that also includes information from ITR12 returns and that blends information for each unique individual taxpayer. The information is sometimes incomplete, and in some cases there are long lags before assessments are finalised. It is this, more complete, administrative data, reproduced in a secure research laboratory at the National Treasury, that has been used for the 2011-2018 income estimates reported below.
For the later years, this analysis relies on summarised aggregate numbers provided by SARS in October 2023 drawn from tax certificates but without the additional information considered in finalising tax assessments. Data from both sources is available for the 2017 and 2018 years. Comparison of these estimates provides a preliminary set of adjustment factors that are applied to the 2019-2023 years to derive more complete estimates of taxpayer numbers and taxable income. Further adjustments are made for the 2021-2023 years to derive taxable income estimates that generate revenue outcomes broadly consistent with actual ordinary PIT revenue collected in these years.
Several other adjustments to the administrative data for the earlier years should be noted and are more fully described in a working paper published by SALDRU and UNU-WIDER.[6]
- Prior to 2017, employer-paid contributions to retirement funds were excluded from income reported to SARS and there were differences between the tax treatment of pension and provident funds. All retirement fund contributions are now recognised for tax deduction purposes, subject to statutory limits (27.5% of remuneration, capped at R350,000 a year).
- Before 2013, medical scheme contributions and medical expenses were deductible, subject to limits. These deductions have been replaced by medical scheme contribution and medical expense tax credits – i.e. amounts that are deducted from the calculated tax liability rather than from income.
To estimate a consistent series of income and taxable income aggregates, it is therefore necessary to adjust the amounts reported by SARS for years prior to 2017 in respect of pension fund contributions and medical expenses. The adjusted estimates report numbers of taxpayers below or above thresholds and aggregate taxable income beforetaking account of medical expense deductions or tax credits.
By applying the applicable tax rates to taxable income estimates distributed between the in-year taxable income brackets, together with estimates by income group of medical tax credits, estimates of PIT tax liability can be calculated. For the Covid-affected 2021 year, the initial calculated tax liability exceeded actual ordinary PIT revenue collected[7] by about 10%. We assume a revenue loss of R30 billion in this year, partially recovered through additional income of R10 billion in 2022 and R5 billion in 2023.[8] In 2022 and 2023, in contrast, alignment of calculated tax liability with actual revenue collected requires upward adjustments in taxpayer numbers and income.
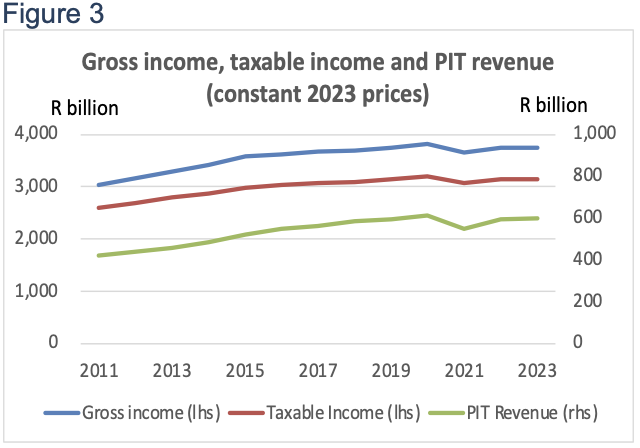
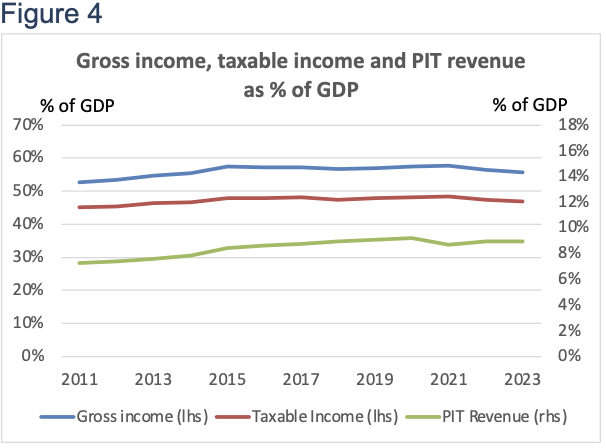
Figures 3 and 4 illustrate the gross income and taxable income series derived from this analysis, together with actual PIT revenue collected, in constant (real) prices, adjusted by CPI, and as a percentage of GDP.
The estimates of gross income, taxable income, and tax liability for the 2011-2023 years derived in this analysis, distributed between taxable income brackets and between real taxable income groups, are set out in an accompanying workbook.[9]
Tax-raising policy measures
The buoyancy of PIT revenue over the past 13 years is in part an outcome of tax-raising policy measures. These include:
- Fiscal drag (bracket creep), or the effect of annual threshold and bracket adjustments that have not compensated fully for inflation;
- Increases of 1 percentage point in marginal tax rates in 2015;
- Addition of a 45% marginal tax bracket in 2017 applied to taxable incomes above R1.5 million,
- Capping of deductibility of retirement fund contributions;
- Tightening of business travel and vehicle allowance schedules, and
- Below-inflation adjustments to medical scheme contribution tax credits.
The transition in 2013 and 2015 from medical expense deductions to tax credits was broadly neutral in its overall impact on tax liability, though its distributional impact favoured lower income tax brackets.
The fiscal drag effect, calculated at the income tax threshold for taxpayers under the age of 65, was highest in the following years:
- 2017: CPI inflation 6.3%, threshold adjustment 1.8%,
- 2018: CPI inflation 4.8%, threshold adjustment 1.0%,
- 2020: CPI inflation 4.2%, threshold adjustment 1.1%,
- 2023: CPI inflation 7.4%, threshold adjustment 4.5%.
Over the 2011-2023 period, the tax threshold declined by approximately 13% in real terms.
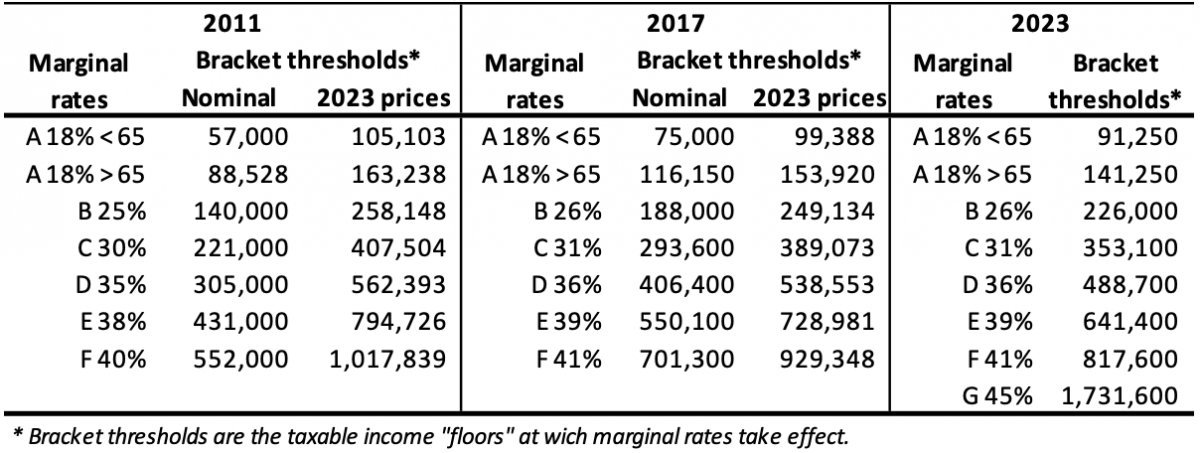
Table 1 sets out the PIT tax brackets for 2011, 2017, and 2023, in in-year nominal prices and in real (2022/23) prices respectively.
Table 1: Taxable income brackets, 2011 – 2023
The distribution of taxpayers and taxable income by tax bracket
It is clear from this analysis that from 2011 to about 2017, the PIT tax base increased strongly despite comparatively slow overall economic growth. In the period since 2017, taxable income has increased more slowly, partially explaining the slow recovery of PIT revenue after the Covid-related decline in 2021.
Table 2 summarises the trend in gross income, taxable income, calculated tax liability, and actual PIT revenue collected. For comparative purposes, estimates are provided of actual “ordinary” PIT revenue, comprising total PIT revenue plus ETI credits paid less the tax paid on lumpsum retirement fund payments, adjusted for refunds paid across tax-years. Calculated tax liability is, as expected, marginally higher than actual ordinary PIT revenue in the years shown.
Table 2: The PIT tax base and revenue collected, 2011-2023
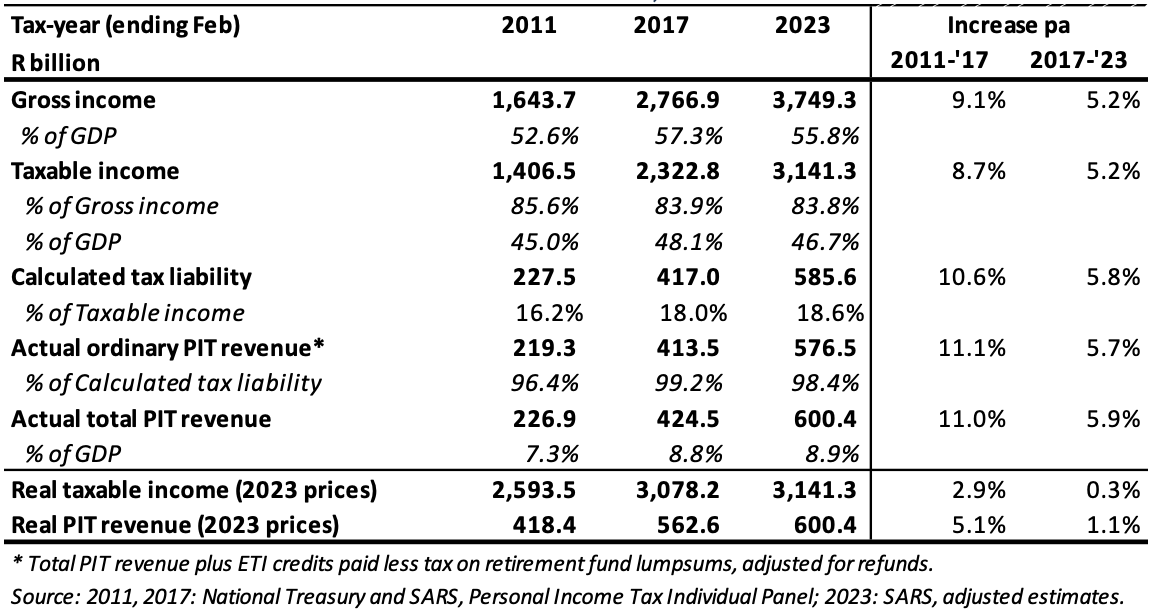
The analysis shows that both gross income and taxable income increased as a percentage of GDP between 2011 and 2017, and then declined. However, tax liability increases as a percentage of taxable income over both periods, contributing to the continued rise in PIT revenue as a share of GDP. Real (CPI adjusted) taxable income increased by 2.9% a year between 2011 and 2017 and by 0.4% a year from 2017 to 2023. The more detailed data indicate that real taxable income peaked in 2020 and by 2023 was still 1.6% lower than in that year. Real PIT revenue increased by just 1.1% a year between 2017 and 2023, compared with its increase of 5.1% a year between 2011 and 2017. In Tables 3 and 4, estimates are set out of 2011, 2017 and 2023 taxpayer numbers and aggregate taxable income distributed between the tax brackets applicable in these years.
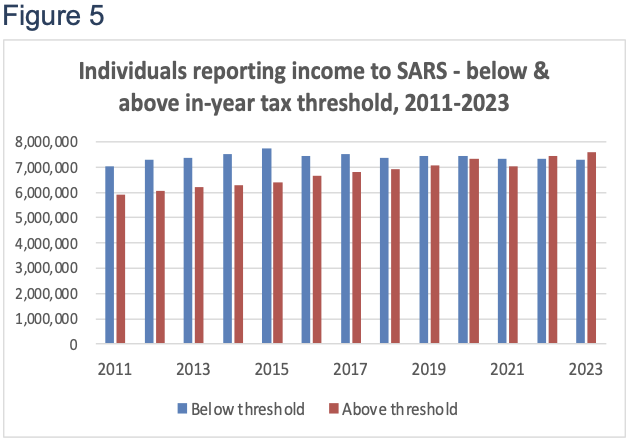
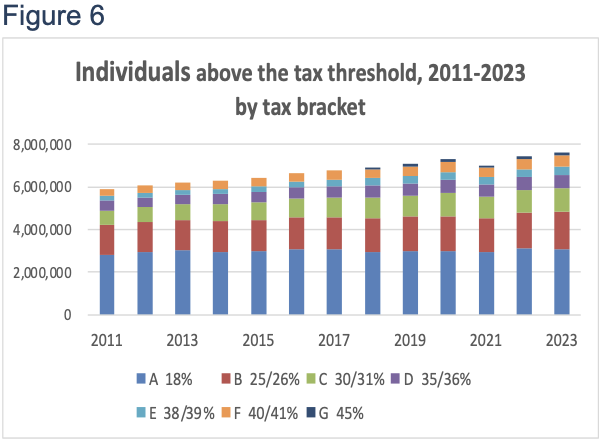
Table 3 shows that the estimated total number of income-reporting individuals increased by 1.7% a year between 2011 and 2017, and by 0.7% a year between 2017 and 2023. Taxpayer numbers have increased more rapidly in higher-income tax brackets, and the proportion of income-reporting individuals above the tax threshold has increased from 45.6% (5.9 million) in 2011 to 51.0% (7.6 million) in 2023.
Table 3: The PIT tax base, 2011-2023 – Taxpayer numbers by tax bracket*
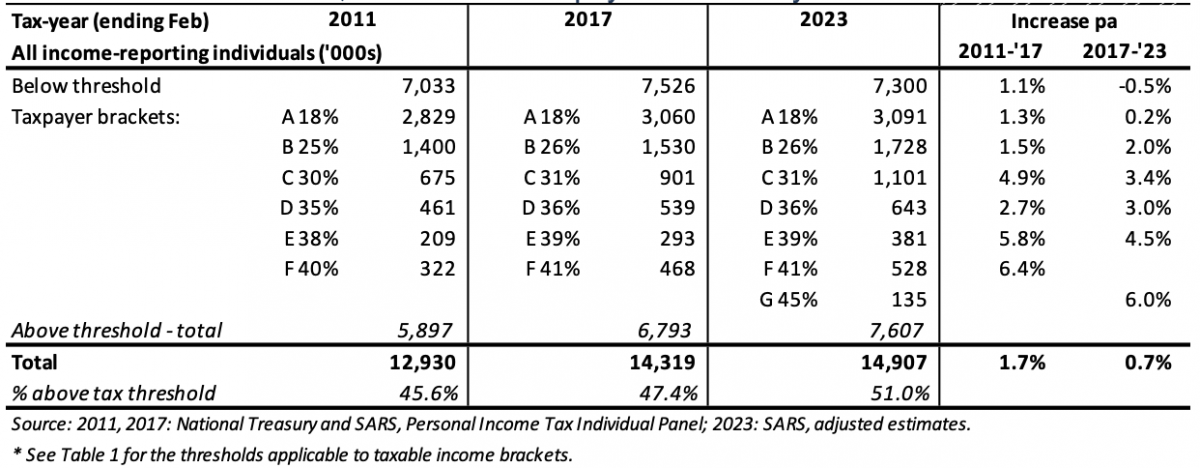
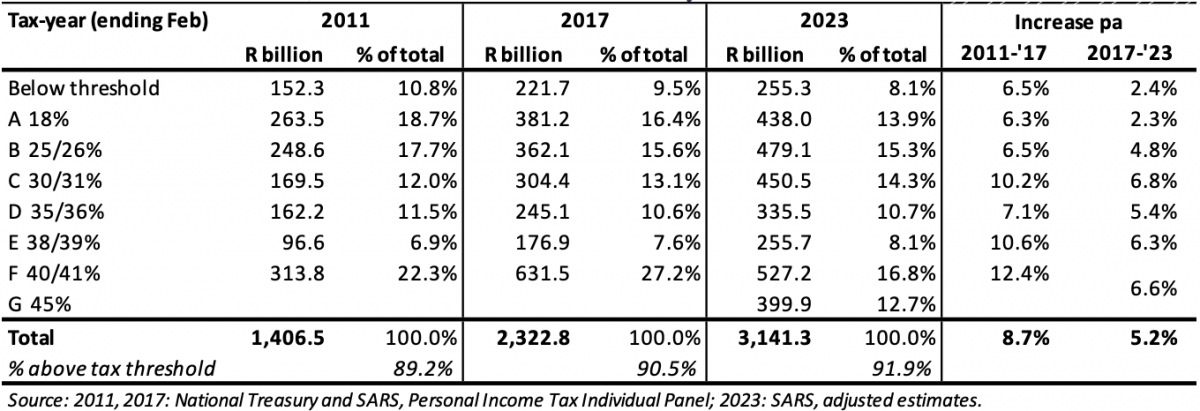
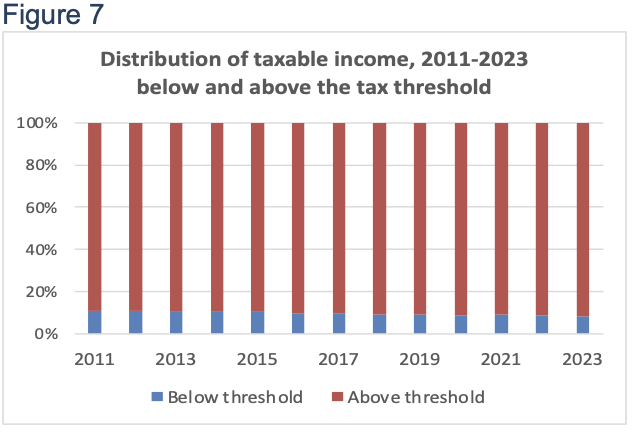
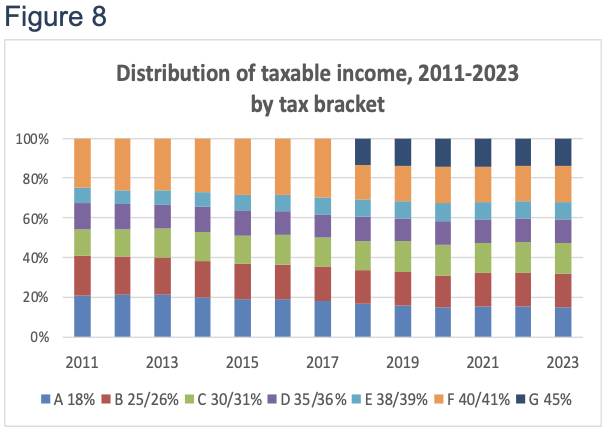
Table 4 indicates the resulting shifts in the distribution of taxable income towards higher tax brackets. In 2011, 40.7% of taxable income was earned by individuals paying marginal rates of 35% or higher; in 2023, 48.3% of taxable income was earned in these tax brackets, now 36% or higher. Income earned by taxpayers above the tax threshold has increased from 89.2% of total taxable income reported in 2011 to 91.9% in 2023, consistent with the apparent broadening of the tax base but also perhaps reflecting a widening of inequality.
Table 4: The PIT tax base, 2011-2023 – Taxable income by tax bracket
These trends are illustrated further in figures 5-8. The distribution of individuals between those above and below the tax threshold is shown in Figure 5, while the distribution between tax brackets of those above the threshold is set out in Figure 6. Figures 7 and 8 illustrate the distribution of taxable income that corresponds with these taxpayer numbers, by tax bracket.
Distribution of taxpayers and income by real taxable income groups
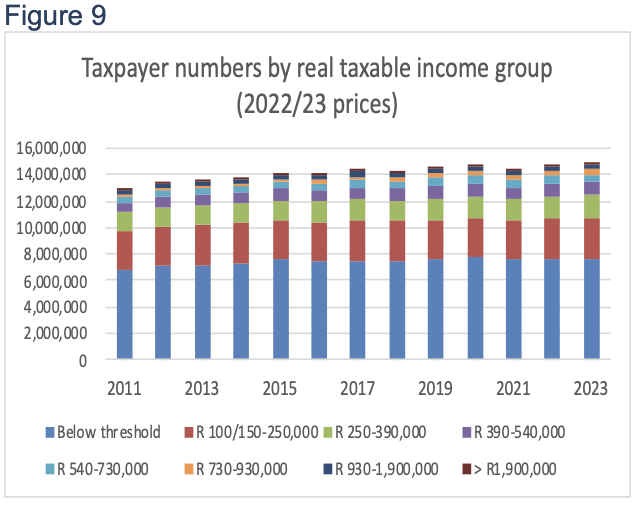
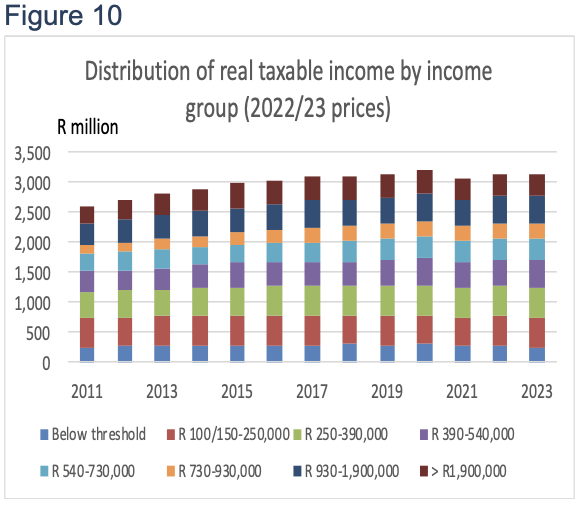
Alongside the distribution of taxpayers by tax brackets, it is instructive also to examine the trend in the distribution by real (constant price) taxable income groups. This is summarised in Tables 5 and 6, and in Figures 9 and 10.
Taxable income groups here are defined by the in-year 2017 tax brackets (expressed in 2022/23 prices), adjusted by CPI inflation for other years, together with an upper-income category consistent with the tax threshold for the 45% tax bracket introduced in 2018.
Table 5: Distribution of taxpayers by real taxable income group, 2011-2023
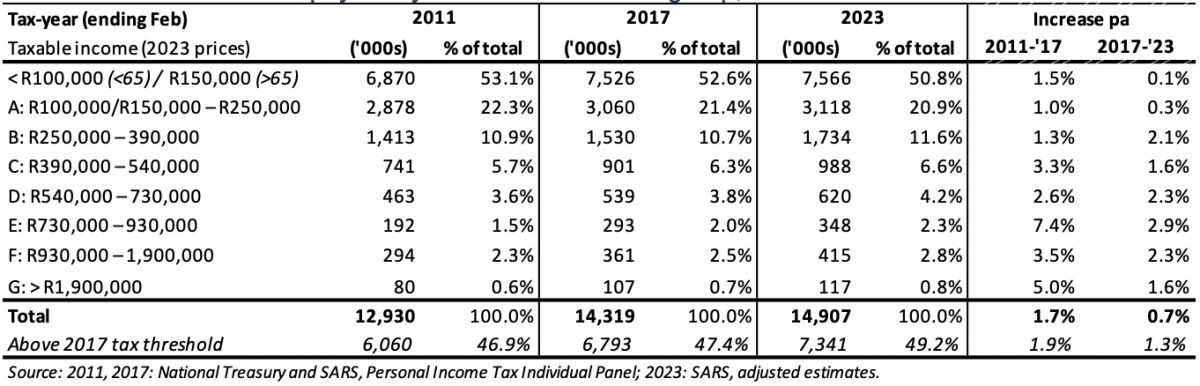
Table 6: Distribution of taxable income by real taxable income group, 2011-2023
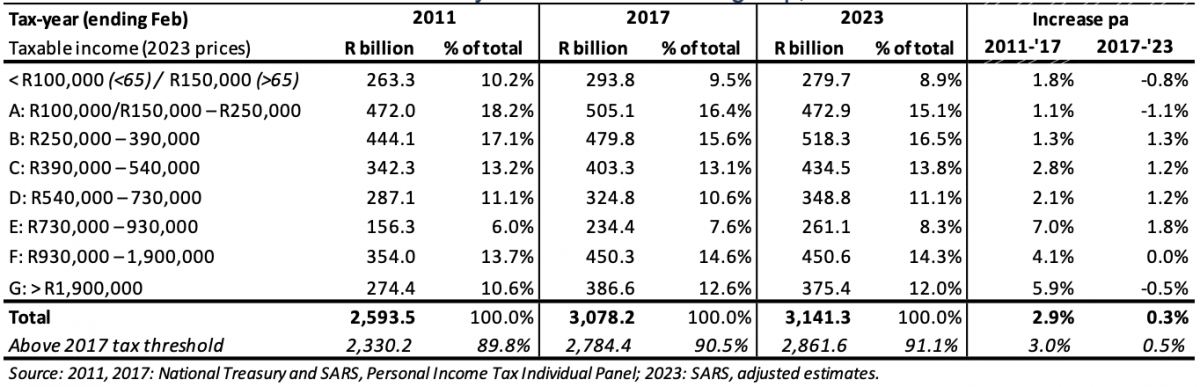
These estimates indicate that the proportion of income earners above the constant-price 2017 tax threshold increased from 46.9% to 49.2% between 2011 and 2023, representing a marked upward shift in the distribution of real taxable incomes. Both in taxpayer numbers and in aggregate taxable income, the income group R730,000-R930,000 exhibits more rapid growth over both the 2011-2017 and 2017-2023 periods than other income groups. The distribution trends suggest that inequality of taxable income widened during the 2011-2017 period.
However, in the period since 2017, faster growth in middle-income cohorts than in the top groups of the distribution appears to have led to some moderation in income inequality. The evident slowdown in the growth of income earners and real income is indicative of South Africa’s deteriorating performance in promoting inclusivity and broad-based development, though median taxable income appears to have increased somewhat.
Figures 9 and 10 illustrate the slowdown in growth in taxpayer numbers and aggregate real taxable income after 2017, exacerbated by the Covid-related decline in incomes in 2021 and the sluggish recovery thereafter. Although the estimated number of income-reporting individuals in 2023 exceeds the 2020 total by about 1%, aggregate real taxable income was still about 1.7% lower than the 2020 level.
Conclusion
The personal income tax base has recovered since the Covid-affected 2021 decline, both in taxpayer numbers and in aggregate taxable income. However, growth in the tax base since 2017 has been considerably slower than during the 2011-2017 period, and real taxable income (adjusted for CPI) in 2023 was still below its 2020 level.
The number of taxpayers above the tax threshold increased from 5.9 million in 2011 to 6.8 million in 2017 and to 7.6 million in 2023. These increases have partly been achieved through the real decline in the tax threshold. However, the overall growth in numbers and a shift upwards in the distribution of real income account for most of this increase. Calculated by reference to the 2017 tax brackets, adjusted for inflation, the number of taxpayers above this constant-price threshold increased from 6.1 million to 7.3 million between 2011 and 2023.
Adjusted for inflation, the fastest growth in taxpayer numbers and in taxable income has been in the R730,000-R930,000 income group (in 2023 prices).
Whereas income inequality appears to have widened between 2011 and 2017, the period since then has seen a more complex trend. The share of taxable income attributable to those above R930,000 (in 2023 prices) increased from 24.3% in 2011 to 27.2% in 2017 and is estimated to have fallen to 26.3% in 2023. However, the percentage of income-reporting individuals above this taxable income level increased from 2.9% in 2011 to 3.2% in 2017 and 3.6% in 2023.
While this analysis confirms the resilience of the PIT tax base against the background of South Africa’s weak economic performance, it also illustrates that progress towards a more inclusive economy has floundered in the wake of the 2020/21 economic setback.
[1] In this paper, “2011” refers to the 2010/11 tax-year (ending in February) or the corresponding fiscal year (ending in March). GDP and actual revenue estimates are for the fiscal year, while taxable income and calculated tax liability estimates are for the tax-year. Real income estimates (in 2023 prices) are calculated by reference to the average CPI index for fiscal years (April-March).
[2] National Treasury, 2023 Medium Term Budget Policy Statement, Table C.8, p. 60.
[3] The 2011-2018 estimates in this research note were derived from cross-tabulations extracted from the administrative tax datasets held at the National Treasury tax data lab by UNU-Wider staff members Mlungisi Ndlovu and Bill Seota in December 2021 and by research assistant Aidan Horn in October 2022. The 2017-2023 summary tables were provided by Mamiky Leolo and Wynnona Steyn of the SA Revenue Service in October 2023.
[4] Statistics SA, Quarterly Labour Force Survey, 2023 3rd quarter.
[5] Helpful overviews of personal income tax in the 2018, 2019 and 2020 years are provided in the 2022 Tax Statistics publication by SARS and National Treasury, pp. 64-66, and the accompanying tables, pp. 157-160.
[6] Donaldson, A.R., (2023). The South African personal income tax base, 2011-2018: Income and taxable income, adjusted for retirement fund and medical expense reporting changes. Southern Africa Labour and Development Research Unit, University of Cape Town (SALDRU Working Paper Number 291).
[7] After adjustment for employment tax incentive (ETI) credits paid, tax on lumpsum payments and previous year refunds.
[8] Covid-related tax relief measures in 2020/21 included partial deferral of employers’ PAYE liabilities. The deferred tax was meant to be paid within the fiscal year, but the data suggest that there were delays in tax collection that extended into subsequent years together with some tax leakage, relative to reported income.
[9] PIT Income analysis 2011 2023.xlsx.
Download article
Post a commentary
This comment facility is intended for considered commentaries to stimulate substantive debate. Comments may be screened by an editor before they appear online. To comment one must be registered and logged in.
This comment facility is intended for considered commentaries to stimulate substantive debate. Comments may be screened by an editor before they appear online. Please view "Submitting a commentary" for more information.