Are internal migrants more likely to be unemployed than locally born residents?
Introduction
As in the rest of Africa, there is a constant flow of people from poorer parts of South Africa to wealthier, more urbanised provinces with stronger economies. For example, net migration into Gauteng and the Western Cape has been and continues to be positive (Ziehl, Econ3x3 2016). A pertinent question is how migrants from poor provinces fare in the labour market in their newly-adopted area or province: do they find jobs or become unemployed?
This article compares the labour-market status of migrants to those of locally born residents in the Western Cape, with a focus on migrants from the Eastern Cape where possible. As used here, the term migrant refers to someone who was not born in the Western Cape or Cape Town (depending on the case) and non-migrant to someone who was born in these areas.
Data sources and geographical areas
Two data sources are used to assess these issues, with one covering a smaller geographical area than the other. The Khayelitsha/Mitchells Plain (KMP) survey took place in 2000 and involved black and coloured residents of the magisterial district of Mitchells Plain. At that time, it was home to more than two-thirds of the African and a fifth of the coloured populations of Cape Town. A predominantly working-class area with high unemployment, it encompassed some established African townships (Langa, Gugulethu and Nyanga), some informal settlements (Crossroads and Browns Farm) and the newly-established township of Khayelitsha, with the first houses having been built in 1986.
The official censuses of 2001 and 2011 provide data for the Western Cape province as a whole and thus present a broader perspective. For the KMP part of the analysis, those born in Cape Town are regarded as locally born, and for the census-based analysis, those born in the Western Cape.
The vast majority of adults in the KMP survey (77%) was not born in Cape Town, with most (56%) having been born in the Eastern Cape. Less than half a percent were born in a foreign country. For the Western Cape as a whole, the census data indicate that 40% and 31% of the population were migrants in 2001 and 2011 respectively. Being based on ‘place of birth’, these data do not indicate when the migrants moved to the Cape.
Findings for Khayelitsha/Mitchells Plain (KMP survey 2000)
The results presented below are derived from a cross tabulation of migrant status and employment status (employed, unemployed and not economically active, as defined by Statistics SA.[1]) The question is whether the labour-market behaviour and status of migrants and non-migrants differ in terms of these three categories. (I also compare my findings briefly to similar South African studies, even though they mostly work at the national level.)
Table 1 and figure 1 show the key measures of labour-market status, using the extended definition of unemployment, which includes discouraged workers.[2] (For results using the narrow definition, see Ziehl 2016b.)
Are migrants less or more likely to be employed than locally born residents?
Combining all forms of employment, the data show that in 2000 migrants in Khayelitsha/Mitchells Plain were somewhat less likely to be employed than non-migrants: 46% of the migrants were employed, in contrast to 50% of the non-migrants.
Table 1: Khayelitsha/Mitchells Plain migrants and migrants (KMP survey 2000)
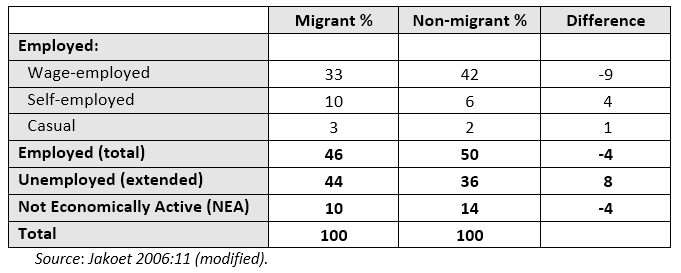
The results further show that migrants were less likely to be in wage employment (33% for migrants against 42% for non-migrants) and that they are more likely to be self-employed (10% against 6%). Still, wage-employment was the most prevalent type of work for both groups.
Are migrants less or more likely to be unemployed than non-migrants?
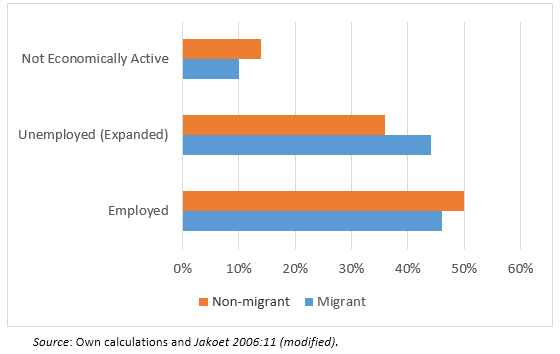
In terms of the expanded definition of unemployment (which includes discouraged workers), adult migrants in Khayelitsha/Mitchells Plain were more likely to be unemployed than non-migrants: 44% for migrants versus 36% for non-migrants. Figure 1 shows these (and other) differences.
Figure 1. Labour market status of migrants and non-migrants in
Khayelitsha/Mitchells Plain (expanded definition of unemployment)
Are migrants less or more economically active than non-migrants?
Migrants in the Khayelitsha/Mitchells Plain area have a lower component of people that are not economically active (NEA): 10%, compared to 14% for non-migrants (using the expanded definition of unemployment). This is reflected in a higher labour-force participation rate[3] of migrants than of non-migrants. The difference is approximately four percentage-points, as shown in figure 1.[4]
Findings for the Western Cape province (Census 2001 and 2011)
The KMP survey was based on one magisterial district in the Western Cape, while other available studies focus on South Africa as a whole. A more sensible comparator would be the Western Cape province, for which data from Censuses 2001 and 2011 are available, as presented below in table 2. The results show the following:
- Employment: In 2001, migrants were less likely to be employed than non-migrants (47% vs 50%), the census figure being very similar to the 2000 KMP figure. However, in 2011 migrants were more likely to be employed than non-migrants (56% vs 49%).
[The 2001 findings the Western Cape and for Khayelitsha/Mitchells Plain differ from those of national-level studies that consistently find higher percentages of migrants to be employed than non-migrants.[5]] - Unemployment (expanded definition): Migrants were more likely be unemployed than non-migrants in both 2001 and 2011, e.g. 27% and 16% in 2001, with a narrower gap in 2011. This pattern is similar to that in the 2000 KMP survey, but the provincial-level unemployment percentages are much lower. [National studies show mixed results.[6]]
- Being economically active: With higher percentages employed and unemployed, migrants in the province were less likely to be ‘not economically active’ (NEA) than non-migrants in both years (26% vs 34% and 21% vs 31%). All these levels of NEA are much higher than for the Khayelitsha/Mitchells Plain area, where participation rates are very high and NEA is at 10% and 14% (see table 1). [Both national studies find higher participation rates for migrants than non-migrants.[7]]
Table 2. Western Cape migrants and non-migrants (Census 2001 and 2011)
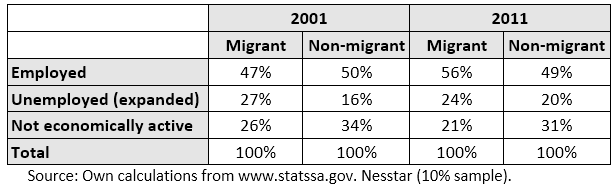
In terms of the historical trend, migrants were better off in 2011 than in 2001, but non-migrants were not. For migrants, the proportion employed increased (47% to 56%) while the proportion unemployed decreased (27% to 24%). In the case of the non-migrants, the proportion employed stayed about the same around 50%, but the proportion unemployed increased by 4%.
The proportion of the migrant population that is economically active (working or wanting to work) has increased and has remained higher than that of non-migrants.
How do we make sense of all of this?
Part of the explanation for the higher rates of employment among migrants than for non-migrants and possibly for the increase in employment among migrants, is that migrants appear to have a greater tendency to create their own employment, i.e. start their own businesses. Although it is a small proportion of all forms of employment, both the KMP survey and the censuses show migrants to be significantly more likely to be self-employed than -non-migrants. Census 2001 shows migrants in the province to be twice as likely as non-migrants to be self-employed (4% vs 2%) (Ziehl 2016b). In the Khayelitsha/Mitchells Plain area the corresponding numbers were higher: 10% and 6%. Migrants from the Eastern Cape showed the highest rates of self-employment, namely 21%.
The higher rates of unemployment among migrants can be explained by a greater tendency to actively seek work. Census 2001 shows that the proportion of migrants that has taken active steps to seek work was double that of non-migrants (25% vs 12%). This was particularly the case when those born in the Eastern Cape are compared to non-migrants (34% vs 12%).
The explanation for the higher rates of labour force participation (or lower rates of ‘not economically active’) among migrants compared to non-migrants is contained in the discussion above. Given that they have made the decision to move to the Cape, presumably in pursuit of a better life, it is not surprising that migrants are more likely to want to work and to actively look for work, or be more industrious with self-employment, than non-migrants. Another possible explanation lies in the age profile of migrants. On the whole, they tend to be younger than non-migrants. Specifically, as shown in figure 2, the proportion of migrants in the 18 to 40 age categories is significantly higher than that of non-migrants.
Figure 2. Age distribution (%): Western Cape migrants
and non-migrants (Census 2001)
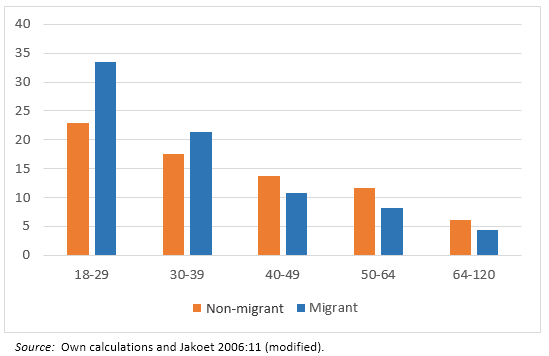
This pattern needs to be seen in conjunction with the family-related considerations. It is possible that young adults (20 to 40 years) have weaker family and community ties than older adults and that this makes them ‘freer’ to change their place of residence and work.
Conclusion
The fear is often expressed that migrants increase unemployment in urban areas. This article has reported research results showing that migrants to the Western Cape are more likely than locally born residents to be both unemployed and employed. This is because they appear to be more likely to be economically active and wishing to work than non-migrants. In addition, they appear to show greater resourcefulness through the creation of own businesses and thereby self-employment, than non-migrants.
The impact of migration on the level of unemployment, or the unemployment rate, of a particular area is a different, and multifaceted, matter. While it is possible that the effect could be to increase the unemployment rate, a number of other factors and labour-market dynamics are also at play. These include the labour-market participation and employment-seeking behaviour of locally born residents, as well as the dynamics of new job opportunities. Migrants might displace other workers, but they might equally create jobs or fill new vacancies, also depending on skills and wages. Therefore, determining the impact of migrants on unemployment in a particular area empirically is more complex than one might suspect.
References
Budlender D. 2014. Executive Summary – Migration and Employment in South Africa: Statistical analysis of the migration module in the Quarterly Labour Force Survey, 3rd quarter 2012. Wits University. Miworc paper 5 (www.miworc.org.za).
Naidoo N, Leibbrandt M & Dorrington R. 2008. Magnitudes, Personal Characteristics and Activities of Eastern Cape migrants: A comparison with other migrants and with non-migrants using data from 1996 and 2001 censuses. Southern African Journal of Demography. 11 (1): 29-66.
Jakoet J. 2006. Assimilation of Immigrants to the Cape Town Labour Market. SALDRU Working Paper Number 06/03, University of Cape Town, September 2006.
Stats SA (Statistics South Africa). Quarterly Labour Force Survey. Quarter 1: 2016. Statistical Release P0211.
SALDRU et al. (2003) Khayelitsha/Mitchells Plain Survey 2000. Survey report and baseline information. Cape Town: UCT.
Ziehl SC. 2016a. Reliability and Validity in Migration Studies – Khayelitsha/Mitchells Plain Survey; Provincial Government Survey and Census 2001. REDI3x3 Working Paper (forthcoming).
Ziehl SC. 2016b. The relationship between employment and migration – the case of Khayelitsha/Mitchells Plain. REDI3x3 Working Paper.
[1] 'Employed’: Someone aged 15 to 64 working for income or family benefit for at least one hour in previous week. Unemployed (strict definition): Someone aged 15 to 64, not employed, actively looking for work and able to start work in previous week. Unemployed (expanded): Someone aged 15 to 64, not employed, wishing to work and able to start work in previous week. ‘Not Economically Active: Someone aged 15 to 64, not employed and does not wish to work (Stats SA 2016:xxi).
[2] Someone who is not employed, but wanted to work, was able to work in previous week but did not take active steps to find work in previous four weeks.
[3] The ‘labour force participation rate’ (LFPR) is the number of people in employment or wishing to work as a proportion of all aged 15 to 64.
[4] For the strict definition of unemployment, the respective numbers are 33% vs 36%.
[5] Using census data for South Africa as whole, Naidoo et al (2008) find that from 1991 to 2001 a third of migrants but only 17% of non-migrants were employed. More recently, using national data from the 2012 Labour Force Survey, Budlender (2014) found that, whereas 65% of foreign migrants were employed, this applied to 58% of local migrants and only 37% of non-migrants.
[6] This finding for Khayelitsha/Mitchells Plain does not correspond with that of Budlender who, using the strict definition, found (for South Africa as a whole) that migrants were less likely to be unemployed than non-migrants (25% vs 36%). On the other hand, it corresponds with the findings of Naidoo et al (2008) who use the expanded definition and show that 27% of migrants are unemployed compared to 24% of non-migrants (1996 – 2001).
[7] Budlender as well Naidoo et al. find a higher participation rate (LFPR) for migrants than for non-migrants.
Download article
Post a commentary
This comment facility is intended for considered commentaries to stimulate substantive debate. Comments may be screened by an editor before they appear online. To comment one must be registered and logged in.
This comment facility is intended for considered commentaries to stimulate substantive debate. Comments may be screened by an editor before they appear online. Please view "Submitting a commentary" for more information.