Covid-19’s economic effects: tourism’s supply-chain impacts
1. Introduction
In 2018, according to the Tourism Satellite Account (TSA) (StatsSA 2019a), tourism’s direct contribution to the economy was 2.7% of Gross Domestic Product, or R130 billion; the sector accounted for about 740 000 direct jobs. In addition, the sector has strong backward linkages to industries that supply it with goods and services – its indirect impacts (UNWTO 2014). The World Travel and Tourism Council (2018) models indirect jobs and for South Africa these were estimated at a further 740 000 in 2018.
There has, however, been limited detailed analysis or disaggregation of these indirect impacts of tourism. This article addresses this gap by identifiying those goods and services attracting the most procurement (demand) from three key tourism industries: ‘Hotels and Restaurants’, ‘Air Transport’ and ‘Recreational, Cultural and Sporting’ activities. It also indicates where this tourism procurement constitutes a significant share of supplying industries’ total value of supply. The latter signals which goods and services are likely to experience a significant sales’ contraction as a result of tourism operations in these subsectors having markedly slowed down around the country due to the National Disaster Act regulations that seek to limit Covid-19 infections.[1] The question is: are these the major, or largest, suppliers – or perhaps not?
The Tourism Industry Survey of South Africa: Covid-19 of July 2020, Survey 2, found that restrictions in the country have led to 61% of tourism businesses having temporarily closed. For 95% of tourism businesses surveyed, revenues were down more than 50% in May 2020 compared with May 2019 (Department of Tourism 2020a).
The analysis in this article is based on StatsSA’s TSA and Supply and Use Tables (SUT) for 2017, which marks the latest data available (although provisional 2018 TSA data has been published).
2. Categorising tourism industries: The Tourism Satellite Account (TSA)
The TSA document explains the difficulties in measuring tourism as an economic sector. “The tourism sector is … an amalgamation of industries such as transportation, accommodation, food and beverage services, recreation and entertainment, travel agencies, etc” (StatsSA 2019a). Tourism is a consumption-based concept that is measured by the expenditure of visitors.[2]
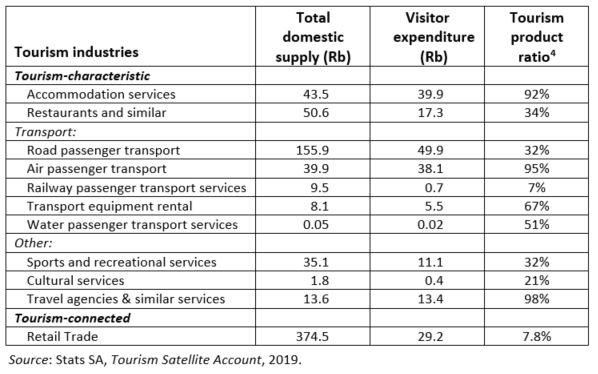
Table 1 lists the so-called tourism-characteristic and tourism-connected industries,[3] their total domestic supply (output), aggregate visitor expenditure on these industries, and the share that this visitor expenditure comprised of total domestic supply of each industry in 2017 (i.e. the tourism product ratio).
Table 1: TSA tourism industries – value of supply and visitor expenditure, 2017
3. Tourism sector’s supply-chain procurement of goods and services: the Supply-Use Tables (SUT)
The Supply and Use Tables for 2017 (released by StatsSA in March 2019) show all the goods and services supplied and used in the economy in a matrix format (Statsa 2019b). The ‘Use’ industries (column headings) include each of the tourism industries which buys goods and services.
Unfortunately the subsectoral definitions of TSA and SUT differ in a number of cases. The SUT data that is publicly available in a few cases uses far broader categories of industry users than the TSA which renders the analysis incompatible.[4] The major loss here is an analysis of the use of goods and services by the passenger land transport and the retail trade associated with visitors.[5] Both these industires have large expenditure values but the SUT is not sufficiently disaggregated to allow for tourism-focused analysis.
Passenger rail, passenger water transport, transport equipment rental and travel agencies and similar services have similarly been excluded from this analysis as the categories covering these industries in the SUT are also far broader than those measured in TSA.
This analysis will instead focus on the Hotels and Restaurants, Air Transport, and Recreational, Cultural and Sporting activities (RCS) industries as their domestic supply numbers in the TSA are roughly similar[6] to their gross output figures in the SUT.
Within the SUT, the rows provide data on the value of the supply of each of the goods and services in the economy. Where the use column meets the supply row the actual Rand value is provided of the supply/use of that particular good or service to the user (e.g. an industry, exports, or households).
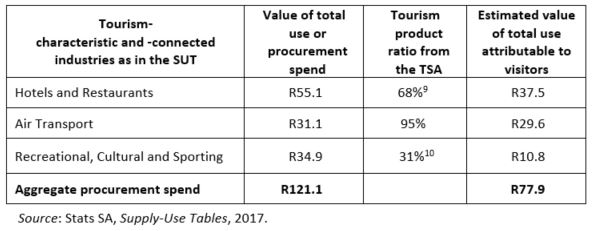
Table 2 shows the aggregate value of the procurement of Hotels and Restaurants, Air Transport and RCS industries, as extracted directly from the SUT.[7] The relevant tourism product ratio for each of these industries from the TSA has been applied to arrive at an estimated value attributable to visitors (or tourism). Together these three industries spent R121 billion on goods and services in 2017 of which R77.9 billion may be attributed to visitors – an important source of demand for goods and services in the economy. The value attributable to visitors is highest for Hotels and Restaurants, followed by Air Transport. It is far lower for RCS industries for which local residents are the main consumer group, not visitors.
Table 2: Value of total use (procurement) of goods and services, 2017 (R billions)
Next calculated are the goods and services on which the three industries spent the greatest share of their procurement or use value in 2017. In order to do this, the procurement spend was disaggregated per good/service for each of the three tourism industries and the relevant tourism product ratios applied.
Hotels and Restaurants industry
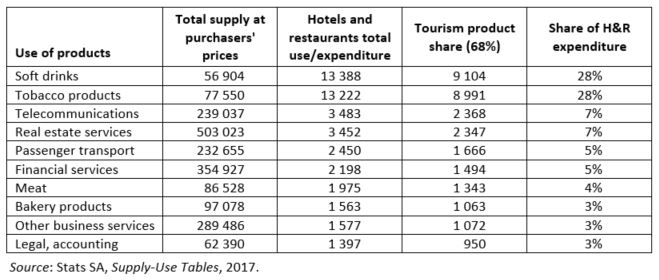
Soft drinks and tobacco products were the largest value items procured by this industry by far, followed by a number of services. Only two food-related goods – meat and bakery products – make it into the top ten procurement categories.
Table 3: SUT Hotel and Restaurant industry – top ten goods and services
procured by value (R millions), 2017
Air Transport industry
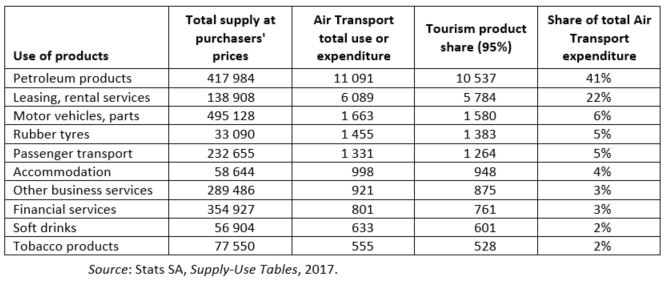
Petroleum products dominate procurement by the Air Transport industry at 41% of total value in 2017. Leasing, rental services (for equipment, not real estate) was also a large value item, followed by other transport-related goods and then a number of services.
Table 4: SUT Air Transport industry – top ten goods and services
procured by value, 2017 (R millions)
Recreational, Cultural and Sporting (RCS) activities
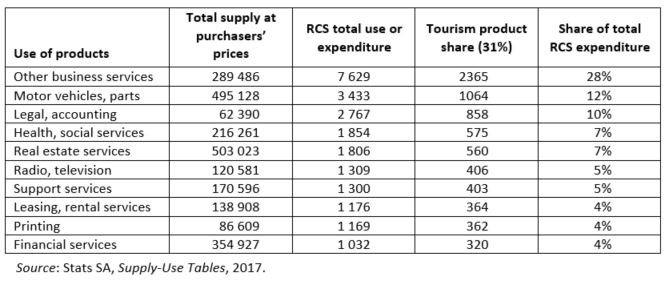
For RCS procurement, other business services dominates at 28% of overall procurement spend; this includes marketing, advertising and consulting work. Motor vehicles, parts and legal, accounting were also large procurement items, followed by a number of other services.
Table 5: SUT RCS industries – top ten goods and services
procured by value, 2017 (R millions)
4. Goods and services which rely on tourism industries’ use
A further analysis was undertaken to establish which goods and services industries relied most heavily on supplying to these three tourism industries. The results of this subset analysis appear in Table 6 and Figure 1. The last column (‘Share of supply’) reflects the vulnerability of the supplying industry to the scale of activity in the three tourism industries.
Table 6: SUT goods and services most reliant on the Hotels and Restaurants,
Air Transport and RCS industries, 2017 (R millions)
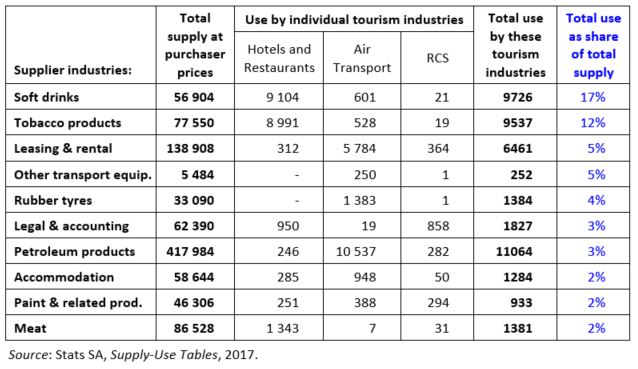
Figure 1: Suppliers most reliant on aggregate use
by share of total supply value
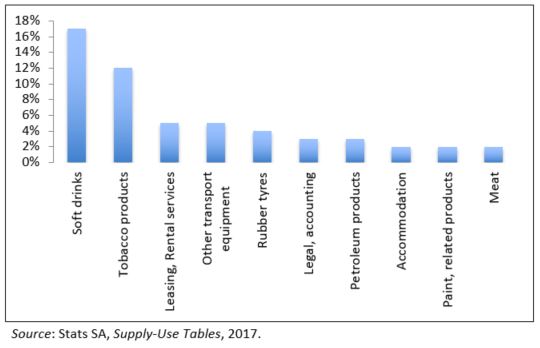
The two tourism supplying industries most vulnerable to Covid-19 impacts are soft drinks and tobacco products. (Note that the Covid-19 ban on the sale of tobacco products means that its high reliance on Hotel and Restaurants is immaterial at the moment). Beyond these two, leasing, rental services, other transport equipment and rubber tyres rely somewhat on tourism use.
The other goods and services in Figure 1 do not have a heavy reliance on tourism.
5. Conclusion
Tourism economic policy discussions have seldom drawn on an analysis of the SUT to rigorously establish (a) on which goods and services the tourism sector spends the most or (b) which industries are dependent on the tourism sector as a major source of demand.
This analysis shows that for three main industry sub-secors, i.e. Hotels and Restaurants, Air Transport, and Recreational, Cultural and Sporting activities the top goods and services procured are those also most vulnerable to fluctuations in these industries. In terms of soft drinks and tobacco products, Hotels and Restaurants spend a significant amount (28% of total procurement) on each of these goods’ categories – while the tourism industries also constitute a substantial share of the overall supply of the soft drinks and tobacco industries (17% and 12% respectively).
What is also notable, is that these are not the goods and services often associated with tourism sector procurement. Perhaps surprisingly, neither agricultural goods (including food) nor construction services are significant categories of tourism sector use.[8] Therefore, they are not the most vulnerable to a decline in tourism-sector turnover. For example, Hotels and Restaurants spend 4% on meat products, which accounted for only 2% of total meat supply. It is also notable that alcoholic beverages do not make it into the top ten categories of expenditure.[9] This is likely because the Hotels and Restaurants category includes many takeout cafes (StatsSA 2020a) and smaller accommodation establishments (StatsSA 2020b).
Aside from soft drinks manufacturers, it is several transport-related goods and services which are probably the worst affected by Covid-19-related contractions in tourism operations. These are ‘pockets’ of industries previously not adequately considered for their tourism linkages.
References
Department of Tourism, 2020a. Tourism Relief Funding for SMMEs. Available online at: https://www.tourism.gov.za/CurrentProjects/Tourism_Relief_Fund_for_SMMEs/Pages/Tourism_Relief_Fund_for_SMMEs.aspx
Department of Tourism, 2020b. Tourism Industry Survey of South Africa: COVID-19, July 2020. Available online at: https://www.tourism.gov.za/CurrentProjects/Tourism_Relief_Fund_for_SMMEs/Documents/South%20Africa%20Tourism%20Survey%202%20on%20COVID-9%20(June%202020)%20Results.pdf
Phillip X. 2020. South Africa VS Coronavirus: Billions already lost in tourism. Available online at: theafricareport.com/30653/south-africa-vs-coronavirus-billions-already-lost-in-tourism/
South African Government, 2020. Minister Nkosazana Dlamini Zuma: Coronavirus Covid-19 Level 3 Lockdown Regulations. 28 May 2020. Available online at: https://www.gov.za/speeches/minister-nkosazana-dlamini-zuma-coronavirus-covid-19-level-3-lockdown-regulations-28-may
Statistics South Africa, 2019a. Tourism Satellite Account for South Africa, final 2016 and provisional 2017 and 2018. Available online at: http://www.statssa.gov.za/publications/Report-04-05-07/Report-04-05-072018.pdf
Statistics South Africa, 2019b. Supply Use Tables. P0441 - Gross Domestic Product, 4th Quarter 2018. Provided by email from LitshaniL@statssa.gov.za on 1 May 2020
Statistics South Africa, 2020a. Food and beverages (preliminary) (Statistical release P6420, May 2020). Available online at http://www.statssa.gov.za/publications/P6410/P6410February2020.pdf
Statistics South Africa, 2020b. Total Accommodation (Statistical release P6410, February 2020). Available online at http://www.statssa.gov.za/publications/P6410/P6410February2020.pdf
UNWTO (United Nations World Tourism Organisation) and International Labour Organisation, 2014. Measuring employment in tourism industries. Guide with Best Pratices. Madrid. Available online at: https://www.e-unwto.org/doi/pdf/10.18111/9789284416158
World Travel and Tourism Council, 2018. Travel and Tourism Economic Impact 2018: South Africa. March 2018. London
[1] The Tourism Relief Fund of R200 million is in the process of has been allocated to qualifying small tourism businesses but excludes upstream suppliers of goods and services to the tourism industries (National Department of Tourism 2020).
[2] A visitor is anyone who travels away from their normal place of residence.
[3] Tourism industries are defined as either (a) tourism-characteristic, where visitor consumption comprises 25% or more of total consumption, or (b) tourism-connected, where visitor consumption is less than 25% of consumption demand.
[4] In the SUT Hotels and Restaurants appear together an one industry, as do Recreational, Cultural and Sporting activities (RCS activities).
[5] In terms of retail trade, the TSA does however, provide some detail on which retail subsectors received the most visitor expediture in 2017: sales of petroleum products, food, beverages and tobacco and textiles, clothing, footwear and leather. Overall, retail trade spends the most on the use of various business services – particularly real estate services, financial services, leasing/ rental services and other business services.
[6] Within 25% variation (and far less for Hotels and Restaurants)
[7] These prices exclude deductible taxes but include other costs paid by the producer to take delivery of the goods and services.
[8] Contrary to the statement made by TBCSA CEO, Tshifhiwa Tshivhengwa, as reported by Xolisa Phillip in The Africa Report, 24 June, 2020 and updated 3 July, 2020.
[9] Although alcohol sales remain an important area of revenue generation for many more formal restaurants.
Download article
Post a commentary
This comment facility is intended for considered commentaries to stimulate substantive debate. Comments may be screened by an editor before they appear online. To comment one must be registered and logged in.
This comment facility is intended for considered commentaries to stimulate substantive debate. Comments may be screened by an editor before they appear online. Please view "Submitting a commentary" for more information.