How big is the illicit cigarette market in South Africa?
Introduction
Illicit trade can take several forms, such as smuggling, counterfeiting, and tax evasion. In South Africa, illicit trade in cigarettes is predominantly about tax evasion. In 2021/2022, the excise tax on a pack of 20 cigarettes was R18.79. The tax burden increases to R21.61 when the 15% VAT on excise is included (R18.79 + R2.82). Since around 2014, local manufacturers have been evading excise taxes by under-declaring the number of cigarettes produced.[1] In 2017, illicit trade accounted for 30%−35% of the total market.
The increase in illicit trade is attributed to the unravelling of the South African Revenue Service (SARS) in 2014. State capture and its impact on SARS’s ability to collect excise taxes on cigarettes has been documented in several books, including Rogue (2016) and Tobacco Wars (2019) by Johann van Loggerenberg, The President’s Keepers (2017) by Jacques Pauw, and Dirty Tobacco (2020) by Telita Snyckers.
There are several methods used to estimate illicit trade, such as the examination of cigarette packs, the price threshold method, and gap analysis. Gap analysis is based on the premise that total cigarette consumption in a country is equal to legal (tax-paid) consumption of cigarettes plus illicit consumption. Self-reported consumption estimates (from survey data) are compared with legitimate sales (as declared to the excise tax authority. The gap between self-reported consumption (scaled up to account for under-reporting) and legitimate sales indicates the size of the illicit market.
Data
- Self-reported consumption estimates
Annual self-reported consumption was estimated using data from three surveys: (1) the All Media and Products Survey (2002−2015), (2) the National Income Dynamics Study (2008−2017), (3) the National Income Dynamics Survey: Coronavirus Rapid Mobile Survey (2020), and (4) the Global Adult Tobacco Survey (2021). Data for 2018-2020 were interpolated. The data consider only those 15 years and older, and are weighted to represent the actual population. Population data are obtained from the United Nations database.
- Legitimate sales
The amount of excise revenue received from domestically produced cigarettes was obtained from annual national budget reviews compiled and published by the National Treasury. These revenue figures were converted into the number of packs sold by dividing revenue by the excise tax per pack. The number of imported cigarettes was obtained from the Department of Trade, Industry and Competition.
Methods and results
I use the year 2021 to illustrate how the gap is estimated:
- Self-reported consumption estimates
In 2021, the South African Medical Research Council conducted a national survey on smoking, the Global Adult Tobacco Survey, which surveyed South Africans aged 15 or older. Although the granular data have not yet been released, a factsheet indicates the daily cigarette smoking prevalence in 2021 was 20.5%. In 2021, there were 42.4 million South Africans aged 15 or older (United Nations population data). That means there were 8.6 million smokers (42.4 million x 20.5%). According to NIDS-CRAM,[2] daily smoking intensity in 2020 was 8.8 cigarettes per smoker. Using the same number for 2021, this amounts to 27.6 billion sticks (i.e., individual cigarettes) smoked in 2021 (8.6 million smokers x 8.8 sticks per smoker per day x 365 days in the year). To account for under-reporting of cigarette consumption, which is common in surveys, I uplift this number by 5%, which results in total consumption of 29.1 billion sticks.
- Legitimate sales
In the 2021/2022 financial year, the government collected R9 158 million in excise taxes from locally produced cigarettes and cigarette tobacco. The excise tax for a pack of 20 cigarettes was R18.79. This means 487 million locally manufactured packs were sold on the legal market (R9 158 million/R18.79) in 2021/2022. Annualising this number to the calendar year 2021 (taking 3/4 of the volume in the financial year 2021/2022 and 1/4 of the volume in the previous financial year 2020/2021) gives 474 million packs. This is equal to 9,474 billion individual cigarettes. Adding to this number the 3,975 billion imported cigarettes results in a total legal cigarette market of 13.5 billion sticks.
The gap
We now have two numbers: 29.1 billion sticks smoked by South Africans in 2021, of which 13.5 billion sticks generated tax revenue. Excise tax was not paid on the difference of 15.6 billion sticks (29.1 - 13.5 = 15.6). This indicates that 54% (15.6/29.1) of the total cigarette market was illicit in 2021. This is based on a smoking prevalence of 20.5% for daily cigarette smokers. If a less strict definition of smoking prevalence is used, i.e., 23.9% (current cigarette smokers), the estimate of illicit trade increases to 58%.
Figure 1
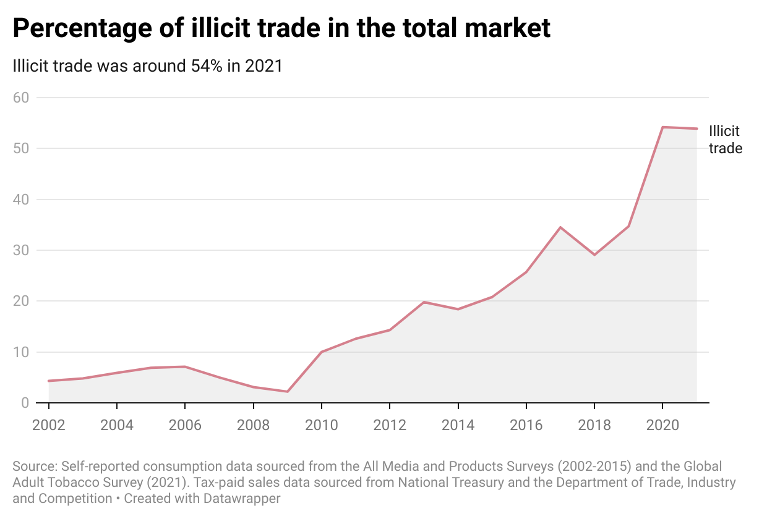
Illicit trade: 2002-2021
Between 2002 and 2009, the illicit cigarette market accounted for around 5% of the total market (See Figure 1). Since 2009, the illicit cigarette market has increased sharply: by 2017 illicit trade accounted for 30%−35% of the total market. By 2020, illicit trade was around 54%. The illicit market was greatly stimulated by the 20-week sales ban in 2020, when no cigarettes were sold legally and when the government received no excise revenue for cigarettes. By 2021, the illicit market remained at around 54%.
Excise taxes and illicit trade
The tobacco industry in South Africa, and globally, often argues that high excise taxes cause smokers to turn to the illicit market, and that excise taxes should therefore not be increased. In South Africa, there is no evidence that excise tax increases are linked to an increase in illicit trade. From 2002−2009, when illicit trade was stable, excise taxes were increasing at an average rate of 6% per year. From 2010−2021 when illicit trade was increasing rapidly, excise taxes were increasing at an average rate of 2% per year. Illicit trade is high because of weak supply chain controls, not because excise taxes are too high.
BATSA’s 70% estimate
At the end of August 2022, the media widely reported BATSA’s findings that illicit trade of cigarettes in South Africa was 70%.[3] BATSA’s general manager Johnny Moloto told News24 that nearly 70% of all cigarettes consumed in the South African market are from illicit brands.
Ipsos, the company hired by BAT to conduct research on illicit trade, sampled 4593 stores. The latest Ipsos report,[4] published online, cites findings from wave 5 of its surveys. Data were collected from 2-9 March 2022. Ipsos uses a mystery shopper methodology, where a ‘shopper’ poses as a consumer at retail stores, and asks to buy the cheapest 20-pack available, and/or the cheapest carton available.
Using the threshold method, which uses retail price to separate legal from illegal cigarettes, Ipsos researchers determine whether or not stores sell illegal cigarettes. They determine four thresholds. The first two thresholds are very low and can be ignored. The third threshold is what they call the Minimum Collectable Tax (MCT) of R22.79, comprised of R19.82 excise rate and R2.97 (15% VAT on excise). The fourth and highest threshold of R27.89 is based on the MCT (i.e., R19.82 excise rate + R2.97 VAT on excise) plus an additional R4.43 (total net margin[5]). The threshold that BATSA reports as illicit in the media is the third threshold of R22.79 and below.
Why BATSA’s estimate is wrong
- BATSA’s estimate of 70% is for Gauteng, not for South Africa as a whole. The national average is in fact 34% (for the threshold of R22.79 and below). On 6 April 2022, BATSA said in a press release: “A shocking four out of five stores in the Western Cape (80%) now sell cigarettes below the Minimum Collectible Tax (MCT) rate of R22.79 per pack, as do almost 70% of outlets in Gauteng, a significant increase compared to previous research.” [bold in original]. It seems that this is the sentence that has gained traction and was reformulated to represent the national average.
The table below comes from Ipsos’s latest report, published on 28 March 2022 (available on BATSA’s media page). According to this table, the share of stores in South Africa that sold cigarettes at or below R22.79 for 20 sticks (a pack) was 34%, not 70%. The table below indicates that illicit trade is particularly problematic in the Free State, Gauteng, and the Western Cape, but much lower in the other provinces (e.g. 0% in the Northern Cape).
If one is comparing illicit trade over time, i.e., between wave 1 (conducted 11-14 February 2021) and Wave 5 (2-9 March 2022), the threshold for wave 1 should be R21.61 and below (R19.70 excise tax + R2.82 15% VAT). The national average in wave 1 was therefore 44%. Based on Ipsos/BATSA data, illicit trade actually decreased between 2021 and 2022.
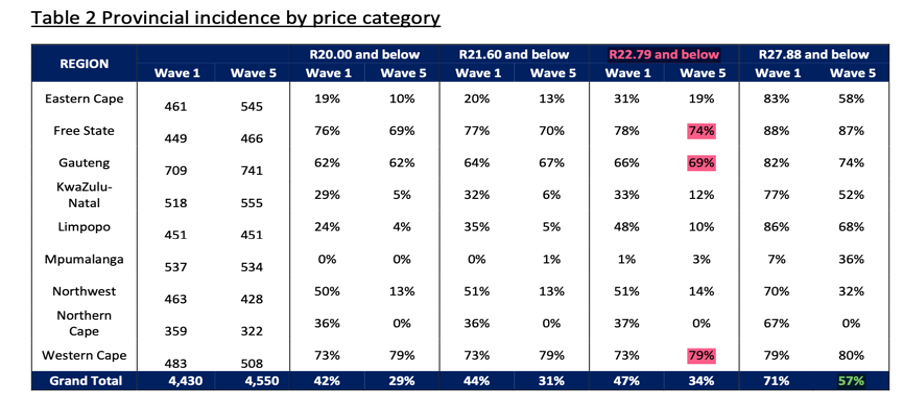
Source: https://www.batsa.co.za/group/sites/BAT_A2ELAD.nsf/vwPagesWebLive/DOCD9BGY/$FILE/BATSA_IPSOS_Cigarette_Retail_&_Wholesale_Price_Research_Wave_5_-_National_Study_04_April_2022.pdf?openelement
- The number of stores that sell illicit cigarettes is not the same as the number of illicit cigarettes consumed. Ipsos found that 70% of retail outlets in Gauteng were selling cigarettes at or below the minimum collectable tax. A shop that sells illicit cigarettes is likely to also sell legal cigarettes. It is misleading to say that 70% of the market in Gauteng is illicit. BATSA should rather be saying that 70% of stores that it sampled in Gauteng sold illicit cigarettes. This is much more accurate.
For example, say there are 10 stores, each selling 100 cigarettes a day (total market of 1000 cigarettes). Three of these stores sell only legal cigarettes (a total of 300 cigarettes a day). Seven of these stores sell illicit and legal cigarettes, say 70 illegal cigarettes and 30 legal cigarettes a day (a total of 490 illegal cigarettes and 210 legal cigarettes). The prevalence of illicit trade would therefore be 49% of the total market (490/1000). On the other hand, 70% of these stores sell illicit cigarettes.
On 6 April 2022, BATSA published a press statement and the Ipsos wave 5 report, and in August 2022, Ipsos’s results were misquoted by BATSA. I considered several reasons why this could have happened: (1) BATSA made a genuine mistake, (2) BATSA deliberately misquoted research to exaggerate illicit trade, or (3) the media misquoted BATSA. That the last was not the case is shown by this direct quote from BATSA’s general manager, Johnny Moloto, to Fin24: ‘Almost 70% of all cigarettes consumed in South Africa belong to illicit brands. This has turned South Africa into the biggest illicit tobacco market in the world, off the back of the five-month national sales ban in 2020, which the Supreme Court of Appeal recently declared was illegal’.[6]
It seems the timing of BATSA’s announcement of the 70% statistic is linked to the recent media coverage of SARS securing a preservation order against the Gold Leaf Tobacco Corporation.[7] BATSA may have taken the opportunity to rework the findings of its March 2022 report to present itself in a favourable light.
On 2 September 2022, I emailed the address (MediaSAA@bat.com) at the end of BATSA’s 6 April 2022 press release[8] asking BATSA where it got the figure of 70%. As of 6 September 2022, I have received no reply.
Conclusion
Illicit trade is extremely high in South Africa, but not as high as the tobacco industry claims. SARS should secure the cigarette supply chain to monitor cigarettes from the point of production to the point of sale. The World Heath Organization’s Framework Convention on Tobacco Control provides guidance on how to do this. These guidelines are detailed in the Protocol to Eliminate Illicit Trade in Tobacco Products,[9] which South Africa has not yet ratified. This protocol has been ratified by more than 65 countries to date (September 2022). The protocol commits governments to taking effective steps to reduce the illicit trade in tobacco products, such as allowing only licensed manufacturers to produce cigarettes and implementing a track and trace system.
If SARS does not secure the supply chain, South Africa will continue to lose valuable revenue.
References
British American Tobacco South Africa. 6 April 2022. Press Release: Illicit cigarette sales surge as criminal manufacturers tighten grip long after lockdown.https://www.batsa.co.za/group/sites/BAT_A2ELAD.nsf/vwPagesWebLive/DOCD8D5H/$FILE/BATSA_IPSOS_Research_(Wave_5)_-_Illicit_cigarette_sales_surge_as_criminal_manufacturers_tighten_grip_long_after_lockdown.pdf?openelement
British American Tobacco South Africa and Ipsos. 28 March 2022. Wave 5 - National Study. Cigarette Retail & Wholesale Price Research. https://www.batsa.co.za/group/sites/BAT_A2ELAD.nsf/vwPagesWebLive/DOCD9BGY/$FILE/BATSA_IPSOS_Cigarette_Retail_&_Wholesale_Price_Research_Wave_5_-_National_Study_04_April_2022.pdf?openelement
Fin24. 29 August 2022. Lockdown lament: Nearly 70% of cigarette consumption in SA now illicit, says BATSA. https://www.news24.com/fin24/companies/lockdown-lament-nearly-70-of-cigarette-consumption-in-sa-now-illicit-says-batsa-20220829
National Income Dynamics Study-Coronavirus Rapid Mobile Survey (NIDS-CRAM) 2020, Wave 3 [dataset]. Version 1.1.0. Cape Town: Allan Gray Orbis Foundation [funding agency]. Cape Town: Southern Africa Labour and Development Research Unit [implementer], 2020. Cape Town: DataFirst [distributor], 2020.
News24. 26 August 2022. Court freezes Gold Leaf Tobacco assets amid SARS tax evasion probe.https://www.news24.com/fin24/companies/court-freezes-gold-leaf-tobacco-assets-amid-sars-tax-avoidance-probe-20220826.
Pauw. J, 2017. The President's Keepers: Those Keeping Zuma in Power and Out of Prison. Tafelberg.
Republic of South Africa: Department of Health and the South Africa Medical Research Centre. Global Adult Tobacco Survey South Africa 2021 factsheet. https://www.health.gov.za/wp-content/uploads/2022/05/Global-Adult-Tobacco-Survey-GATS-SA_FS-Populated__28-April-2022.pdf.
Republic of South Africa: Department of Trade and Industry. 2019. Trade data. http://tradestats.thedti.gov.za.
Snyckers, T. 2020. Dirty Tobacco: Spies, Lies and Mega-Profits. Tafelberg: NB Publishers.
South African Audience Research Foundation. 2015. All Media and Products Survey. Version 1.1. Johannesburg: South African Audience Research Foundation [producer]. Cape Town: DataFirst [distributor], 2019.
Southern Africa Labour and Development Research Unit. National Income Dynamics Study 2017, Wave 5 [dataset]. Version 1.0.0 Pretoria: Department of Planning, Monitoring, and Evaluation [funding agency]. Cape Town: Southern Africa Labour and Development Research Unit [implementer], 2018. Cape Town: DataFirst [distributor], 2018. DOI: 10.25828/fw3h-v708.
Van Loggerenberg, J. 2019. Tobacco Wars. Cape Town: South Africa: Tafelberg: NB Publishers.
Van Loggerenberg, J. 2016. Rogue: The Inside Story of SARS's Elite Crime-busting Unit. Jonathan Ball Publishers.
Van Walbeek., Hill., R, Filby,. S, Van der Zee., K. Market impact of the COVID-19 national cigarette sales ban in South Africa. https://cramsurvey.org/wp-content/uploads/2021/02/11.-Van-Walbeek-C.-Hil...
Vellios, N., Ross, H. & van Walbeek, C. 2019. The illicit trade of cigarettes in South Africa: 2002−2017. Tobacco Control. 10.1136/tobaccocontrol-2018-054798. DOI:10.1136/tobaccocontrol-2018-054798.
World Health Organization. 2013. Framework Convention on Tobacco Control. Protocol to Eliminate Illicit Trade in Tobacco Products. https://fctc.who.int/protocol/overview
[1] Van Loggerenberg, 2019
[2] Van Walbeek et al, 2021
[3] For example, Fin24. 29 August 2022.
[4] BATSA and Ipsos, 28 March, 2022
[5] All costs (production, leaf, material, and supply chain) and margins (retailer, wholesaler, and manufacturer).
[6] Fin24. 29 August 2022.
[7] News24. 26 August 2022
[8]https://www.batsa.co.za/group/sites/BAT_A2ELAD.nsf/vwPagesWebLive/DOCD8D5H/$FILE/BATSA_IPSOS_Research_(Wave_5)_-_Illicit_cigarette_sales_surge_as_criminal_manufacturers_tighten_grip_long_after_lockdown.pdf?openelement
[9] World Health Organization, 2013.
Download article
Post a commentary
This comment facility is intended for considered commentaries to stimulate substantive debate. Comments may be screened by an editor before they appear online. To comment one must be registered and logged in.
This comment facility is intended for considered commentaries to stimulate substantive debate. Comments may be screened by an editor before they appear online. Please view "Submitting a commentary" for more information.