How do the non-searching unemployed feel about their situation? On the definition of unemployment
Introduction
The debate about who is unemployed and who is not has never been more pertinent than it is now: South Africa recorded a strict unemployment rate of 25.2% and a broad unemployment rate of 36.7% in the first quarter of 2013 (Statistics SA, 2013). For a long time such unemployment rates appeared unrealistic, or even impossible. But, since the financial crisis of 2008, many other countries in both the developing and developed worlds too have experienced uncommonly high levels of unemployment, and there are serious concerns about the high unemployment rate amongst the youth (currently at 52.9% for ages 15-24).
In South Africa, ‘discouraged workers’ – people who are unemployed but appear not to be searching for jobs – are recorded, but are not included in the official definition of unemployment. In a recent Econ3x3 article, Posel, Casale and Vermaak argue that such ‘non-searching unemployed’ persons should be included in the official definition of the unemployed, inter alia because they are no less likely to find work than the ‘searching unemployed’ – the two groups are equally committed (and likely) to find work.
In a 2006 paper, Kingdon and Knight adopted a different approach to determine the appropriate way to deal with the non-searching unemployed in official statistics and policies. As explained below, they used information on the happiness or unhappiness of non-searching unemployed people relative to that of other groups and concluded (using 1993 data) that the non-searching unemployed in South African should not be treated differently from the searching unemployed.
When we re-examined this issue using contemporary data from the National Income Dynamics Study,[1] we find new, and better, evidence that the non-searching unemployed are equally, or even more, ‘unhappy’ than the searching unemployed. Indeed, their life satisfaction has hit rock bottom. Based on these considerations, there are no grounds for excluding the non-searching unemployed from measures of unemployment.
Background to the debate
The international literature on unemployment centres on two arguments. The first of these, the ‘discouraged worker’ hypothesis, argues that whether unemployed people are searching for a job or not (their ‘search status’) is determined by their economic circumstances. The searching unemployed are people who face better prospects of getting a job (than those who are non-searching) because of factors such as their skills and where they live. These are the features that motivate them to search for jobs. Similarly the non-searching unemployed are discouraged from searching for jobs in regular ways. However, both groups want employment and both groups are appropriately classified as unemployed.
A contrasting approach adopts the ‘taste for unemployment’ hypothesis in which an unemployed person that is not searching for a job is deemed to have chosen not to work. In such a view, the non-searching are voluntarily ‘unemployed’ – thus they are best classified as non-participants in the labour market (like a student or a stay-at-home parent). Only if it can be shown that the non-searching unemployed have ceased searching for a job because of exogenous factors could they be considered as unemployed.
Let us consider the three groups of people who are not working:
- Searching unemployed people (i.e. who are looking for work);
- Non-searching unemployed people (i.e. who are not job-seekers); and
- People who are not economically active (i.e. who are not part of the labour force).
The issue is to clarify the significant differences or similarities between these groups and to establish whether the middle group rightly belongs with the first group or with the third group.
To answer this question, Kingdon and Knight (2006) analyse the characteristics of the middle group (group 2) to see whether they have similar characteristics to the searching unemployed (group 1) and are sufficiently distinct from the not economically active (group 3). They start by assuming that people strive for happiness rather than unhappiness. Therefore, if an unemployed person has chosen to be unemployed and to remain so, one expects them to be as satisfied with life as people who have chosen not to work (the people in group 3 who are not economically active). This means that group 2 belongs with group 3. However, if they are significantly less satisfied, there is reason to think that their unemployment is not acceptable to them and is not voluntary (even if they appear not to be searching for a job). This means that group 2 belongs with group 1 and that the members of the former group are rightly seen as being unemployed.
Using self-reported data about the life satisfaction of each group from labour force surveys to compare their subjective wellbeing, Kingdon and Knight found evidence that, in South Africa, group 2 indeed belonged with group 1. On this basis they argued for acceptance of the ‘discouraged worker’ hypothesis and the recognition of the discouraged as unemployed members of the labour force.
Update: the relationship between life satisfaction and employment states in 2008 and 2010/11
We use data of the 2008 and 2010/2011 waves of the National Income Dynamics Study (NIDS). The variable of interest is the perceived life satisfaction of working-age adults (aged 15–64). The variable is derived from answers to the following question: on a scale of 1 to 10 on which 1 means ‘Very dissatisfied’ and 10 means ‘Very satisfied’, how do you feel about your life as a whole right now?
Figure 1 shows the mean levels of satisfaction for each of the four labour market groups for 2008 and 2010/11. For both years, the average level of satisfaction amongst both the searching and non-searching unemployed is significantly lower than that of the people who are not economically active (as well as for the employed). This result suggests that the non-searching unemployed should not be grouped together with the not economically active (group 3), and should be classified as unemployed, together with those in group 1. However, we will analyse this in more depth below.
It also is noticeable that the non-searching unemployed have the lowest values – this group is least satisfied with its situation in life. This may be an indication that they are in a state of discouragement, that they have lost hope, etc. because active searching activities seem to reflect a somewhat more hopeful attitude.
Figure 1
Life satisfaction across employment states in 2008 and 2010/11
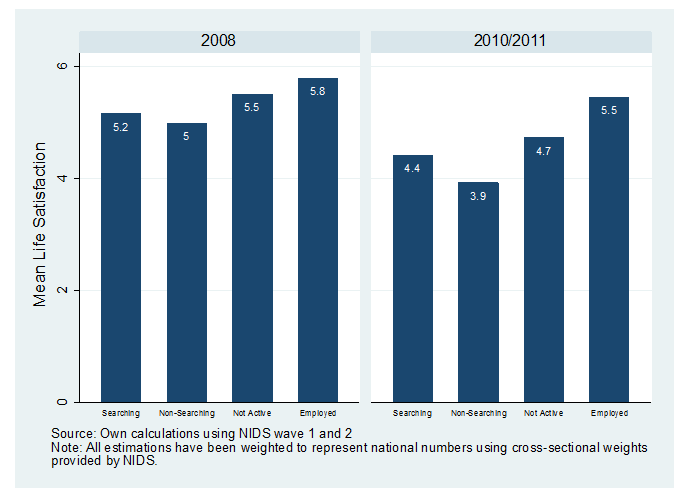
A third observation is that the average satisfaction of all groups decreased between 2008 and 2010/11. This is in line with Posel’s (2012) findings for the population as a whole: people became unhappier with their life situation between 2008 and 2010/11.
Something new: Does moving from one group to another change someone’s life satisfaction?
A special quality of NIDS is that the 2010/11 data comes from second interviews with the same people that were interviewed in 2008. This enables one to evaluate any change in the life satisfaction of people who have moved between these three groups or states – e.g. people who went from being searching unemployed to being non-searching unemployed – in contrast to people who remained in a particular state.
Table 1 tracks the change in the labour market state of those who were 15-64 in 2008 and who were interviewed for a second time in 2010/2011. It reports the average change in life satisfaction for various transitions between labour market states between 2008 and 2010/11.
Table 1
Mean changes in the levels of life satisfaction linked to changes in labour market state
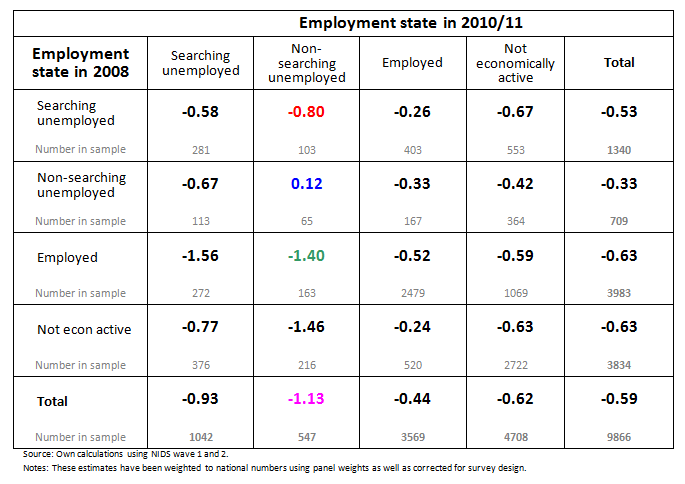
Several interesting points can be highlighted:
- People who changed from being employed in 2008 to ‘non-searching unemployed’ in 2010/11 reported a drop of 1.4 (the green number) in their average life satisfaction (i.e. from a count of 5.8 in 2008 to 4.4 in 2010/11).
- People who went from ‘searching unemployed’ to ‘non-searching unemployed’ reported a drop of 0.8 (the blue number) in their average life satisfaction (i.e. from a count of 5.2 to 4.4).
- Of interest (although the sample is small) is the fact that those who remained non-searching between waves did not report such an average decline in satisfaction – they pretty much stayed at the same level of dissatisfaction.
Altogether, those who entered the non-searching status from whichever group report a large drop of 1.1 (the pink number) in satisfaction. As can be seen in the bottom row, theirs is the highest average drop of all states in 2010/11. In particular, those who became not economically active experienced a much smaller reduction (0.6) in satisfaction. In comparison, across all states in the 2008 labour market, those who were originally discouraged (non-searching) experienced a lower average decline in satisfaction between waves.
The diagonal, which represents those whose labour market state did not change between waves, shows that even those who remained employed after 2008 reported a decline in satisfaction.
Figure 1 above shows that, on average, the discouraged were less satisfied than even the searching unemployed in both waves. From the above table we see that the transition from searching to non-searching unemployment involved a drop in satisfaction (red number), whilst those who remained discouraged experienced no drop in satisfaction between waves (blue number). This suggests that those who would like to work but are not actively searching for a job have reached their nadir.
Making sure: Are ‘discouraged workers’ really different from those who are not economically active?
The comparisons in figure 1 are subject to error because many factors other than a person’s labour market state could have influenced the satisfaction levels indicated by the respondents in the NIDS surveys. These include their levels of income, education, health, race, gender, age, and so forth. Statistical and econometric techniques can be used to remove the estimated influence of these other factors and thus isolate the estimated impact of labour market state on the life satisfaction.
The results from such an exercise show a clear picture: there is a statistically significant difference between the life satisfaction of the non-searching unemployed and those who are not economically active. A non-searching unemployed person (group 2) is 4.4% more likely to have the lowest satisfaction level (of 1) than somebody who is not economically active (group 3) (for further detail see Lloyd and Leibbrandt, 2013). Likewise, people in group 2 are 3% less likely to report the highest satisfaction level than members of group 3. This may not sound like much, but statistically it is highly significant, given that satisfaction is a variable that typically displays relatively small variations across individuals – this makes differences of 3% and 4.4% meaningful or ‘large’. There is little doubt that non-searching unemployed people (group 2) are more unhappy than the group who have chosen not to be economically active (group 3). This establishes a statistically significant difference between these two groups of people, as measured by their life satisfaction.
A last bit of evidence: for the searching unemployed there are similar differences vis-à-vis the group that is not economically active, but they are smaller (and not as strong statistically[2]). The important point is that the non-searching unemployed (group 2) differ more from the group that is not economically active (group 3) than the searching unemployed (group 1).
In contrast, there is no statistically significant difference between the life satisfaction patterns of the employed and those who are not economically active. Individuals in these two states are likely to have similar levels of satisfaction.
Conclusion
Based on the assumption that no one would choose to be dissatisfied, we find strong support for the ‘discouraged worker’ hypothesis in recent South African data. The non-searching unemployed appear to be distinct from those who are not economically active in terms of their subjective wellbeing. The evidence goes further to suggest that the non-searching unemployed have less satisfaction with life than even the searching unemployed. Moreover, those who become non-searching unemployed, having migrated from either of the other labour market situations, experience the largest drop in life satisfaction. The non-searching state appears to be the lowest position with regard to subjective wellbeing.
In contrast, the life satisfaction of people who are economically inactive – e.g. those who are not looking for work because they are studying, voluntarily caring for children or managing the home – appears to be as high as that of the employed. This is a most striking finding. It implies a world of difference between people who are not economically active and the non-searching unemployed.
As in 1993, it is true that the non-searching unemployed in South Africa are involuntarily unemployed and should be seen and counted as being unemployed (and thus also be included in the definition of the labour force). This serves as a sobering caution to those who blithely speculate that South African unemployment cannot be as bad as it is made out to be.
References
Kingdon, G. and Knight, J. (2006).The measurement of unemployment when unemployment is high. Labour Economics, 13, 291-315
Lloyd, N. and Leibbrandt, M. (2013). New evidence on subjective wellbeing and the definition of unemployment in South Africa. Working Paper 94, SALDRU, University of Cape Town.
Posel, D. (2012). Self-Assessed Wellbeing: Analysis of the NIDS Wave 1 and 2 Datasets. Working Paper 79, SALDRU, University of Cape Town.
Statistics SA (2013). Quarterly labour force survey: Quarter 1. Press Statement (6 May 2013). Available at: www.statssa.gov.za/news_archive/Docs/QLFS_Press_statement_Q1_2013.pdf
[1] Murray Leibbrandt is the DST/NRF Chair in Poverty and Inequality Research and Neil Lloyd is a researcher in SALDRU. Murray Leibbrandt acknowledges the Research Chairs Initiative of the Department of Science and Technology and National Research Foundation for funding his work as the Research Chair in Poverty and Inequality.
[2] A searching unemployed person has a 1.3% higher probability of reporting the lowest satisfaction level and a 1% lower probability of reporting the highest satisfaction level than any not-economically-active individual. These probabilities are statistically significant at the 10% level.
Download article
Post a commentary
This comment facility is intended for considered commentaries to stimulate substantive debate. Comments may be screened by an editor before they appear online. To comment one must be registered and logged in.
This comment facility is intended for considered commentaries to stimulate substantive debate. Comments may be screened by an editor before they appear online. Please view "Submitting a commentary" for more information.
Thanks very much for a very
Thanks very much for a very important addition to the understanding of unemployment dynamics.
In the survey work that I have done, I have found an inverse correlation between age and life satisfaction. Is this something that you have looked at in your research? I would be interested to know if this is also present in the NIDS survey and then if there is an inverse correlation between age and life satisfaction.
If this is the case, would the relationship that you find, still be significant once taking age into account? My gut feel is that it probably would but would be interesting to see the relative significance.
Dear reader, thank you for
Dear reader, thank you for your comments and questions.
The relationship between age and subjective well-being is a complicated one, espeically because age is a proxy for such a variety of factors (health, lifestyle, income, etc.). Yes, we have looked at the relationship between age and life satisfaction, but it has never been the focus of our research. In the SALDRU working paper that forms the foundation for this short paper (Lloyd and Leibbrandt, 2013), we control for age in all of our multivariate regressions.
As you alluded to, there is a broad literature on the relationship between age and subjective wellbeing. The one that we reference in this working paper and in ones to come starts with the work of Clark and Oswald (1994) who find a u-shaped (postive quadratic) relationship between age and satisfaction. Their work is based on British panel data. Winkelmann and Winkelmann (1998), whose findings are based on German panel data, do not find this relationship. The debate is summarized well by Ferrer-i-Carbonell and Frijters (2004) who give a good explanation for why the findings vary so much in the literature. In short, the variation lies in the fact that age is a proxy variable, and therefore highly dependent on the set of regressors used in each analysis.
In continuation with the literature, we included age as a quadratic variable in our multivariate analyses. In all of our findings so far, based on the NIDS data, we find a significant quadratic relationship; however, the turning point is unrealisitcally high - around 130 years of age. Nevertheless, the relationship between unemployment and subjective well-being after controlling for age and a host of other individual and household level variables remains signficant. The table of probablities reported in this paper are conditional on these individual and household variables.
I hope that my answer has been insightful and helpful.