How effective is income tax in reducing inequality in SA?
Introduction
Personal Income Tax (PIT) lends itself to the possibility of increasing revenue collection and reducing inequality, while keeping increases in poverty to a minimum.[1] It therefore seems sensible that a high-inequality country such as South Africa would rely relatively more on a PIT than on other taxes that are less progressive, such as a Value Added Tax (VAT).[2] On the other hand, if the incidence of tax on the rich is perceived to be unfair, illegitimate, or too burdensome, then wealthy individuals may choose to go elsewhere,[3] with two potentially negative consequences: a smaller tax collection to finance service provision for the rest of the population, and reduced economic growth - if those individuals take their businesses with them, and possibly jobs.
While most South Africans may prefer to live in a place without many of the chronic ills that we face – high crime rates, addiction, homelessness, and obesity – all strongly correlated with high levels of inequality[4], not all agree that high taxation improves the situation. A recent debate in the Daily Maverick neatly laid out many of the arguments and counter-arguments on raising tax levels. Maverick business editor Tim Cohen[5]argued that in terms of “value for money”, wealthy South African taxpayers are paying OECD levels of taxation but not getting the same levels of service delivery, and that high tax rates were resulting in tax evasion or in the overburdened wealthy leaving the country[6], exacerbating the economic recession and resulting in a lower-than-expected tax collection. He argued that increased revenue collection would be more appropriately executed through increasing economic growth, rather than increasing tax rates.
His arguments may appeal to many of the country’s middle and upper class but were sloppily made. Some South African tax experts, including Judge Dennis Davis of the Davis Tax Committee[7], expressed frustration. The value-for-money argument assumes that the rich should be funding services used by the rich, whereas in a country with a legacy such as ours, the PIT is at least equally (if not primarily) a means to fund services for the poor, and redress market inequality.[8] Cohen’s argument overlooks this redistributive function (and inequality-reducing impact) of the PIT.
He does touch on a different argument, however – that of institutional legitimacy. We know that state money has been diverted in the past, and still is to some extent. Some argue that it is illegitimate to increase taxes while there is corruption or waste.[9] Others have even argued for “tax revolts” to punish the state for its mistakes: the case of the Gauteng e-tolls is an obvious example. While the emotional appeal is obvious, it is unclear how we go about rebuilding a functioning state in this way.[10]
On the other end of the spectrum is the belief that the post-apartheid government has not been radical enough in its redistributive policies. The persistent levels of market inequality may suggest that taxation of income and cash transfers has been insufficient to right historical inequalities. In 2018, the Davis Tax Committee said: “In light of the vast historical and increasing wealth inequality in South Africa… which is a threat to social stability, the Committee is clearly in favour of the introduction of a comprehensive wealth tax as soon as possible” and attached a list of recommended preparative actions.[11]
We argue that dollar millionaires leaving the country is less a question of the level of tax itself, and more about perceptions: do these levels of tax seem fair, and is the state using revenues effectively to address chronic social ills?
This paper seeks to provide evidence and quantifiable measures of how the South African PIT is distributed, its size relative to other unequal countries, and its impacts on inequality and poverty.
We show that the South African PIT is strongly progressive.[12] Among developing countries, it is one the largest as a percent of GDP, and it is concentrated amongst the top two income deciles Using comparative data from the Commitment to Equity Institute’s Data Centre (CEQ), we show that the burden, as a share of market income, on the richest decile is higher only in Tunisia. While there are a number of countries in the database that collect a larger proportion of the tax from the richest decile than South Africa, the size of the tax collection is smaller, reducing the burden on the richest deciles (as a share of income).
However, the marginal impact of income tax on inequality has increased. We examined changes over time, by back- and fore-casting a fiscal-incidence model based on 2015 microdata to simulate the impact of fiscal policy in 2011 and 2020, and analyse the impact of policy changes designed to increase the progressivity of Income Tax.[13]
We also show that, while the changes made to the structure in the past decade have resulted in a tax that has a larger marginal impact on inequality (1.75 versus 1.64 Gini points at market income in 2020 versus in 2015) and that has increased as a share of income for the top three deciles, that the tax has become less progressive if we measure progressivity using the Kakwani Index[14] and relative to market income. So while in absolute terms the rich are paying slightly more, as a share of their income they are paying less.
How important is Personal Income Tax to the fiscus?
In 2015, the year of the last official household survey, the PIT was the South African government’s largest tax instrument, at 8.7% of GDP.[15] By comparison, Corporate Income Tax (CIT) and VAT were 4.6 and 6.5% of GDP respectively.
The PIT has become more important as a fiscal instrument. In 2011, it generated 34% percent of total tax revenue. This increased to 36% in 2015, and 39% in 2020, while the CIT and VAT both decreased as a proportion of tax revenue, from 20% in 2011 to 16% in 2020 for the CIT due to the CIT rate decrease in 2013[16], and from 27% in 2011 to 26% in 2020 for the VAT (Table 1) .
Table 1: Size of income tax
|
|
PIT |
CIT |
VAT |
||||||
|
Percent of: |
2011 |
2015 |
2020 |
2011 |
2015 |
2020 |
2011 |
2015 |
2020 |
|
GDP |
7.5 |
8.7 |
10.4 |
4.4 |
4.6 |
4.2 |
6.1 |
6.5 |
6.8 |
|
Gross tax revenue |
33.7 |
35.8 |
38.9 |
19.7 |
18.7 |
15.6 |
27.2 |
26.5 |
25.6 |
|
Direct taxes |
59.7 |
62.8 |
68.3 |
35.0 |
32.9 |
27.4 |
48.3 |
46.5 |
44.9 |
|
Source: 2021 Budget Review |
|||||||||
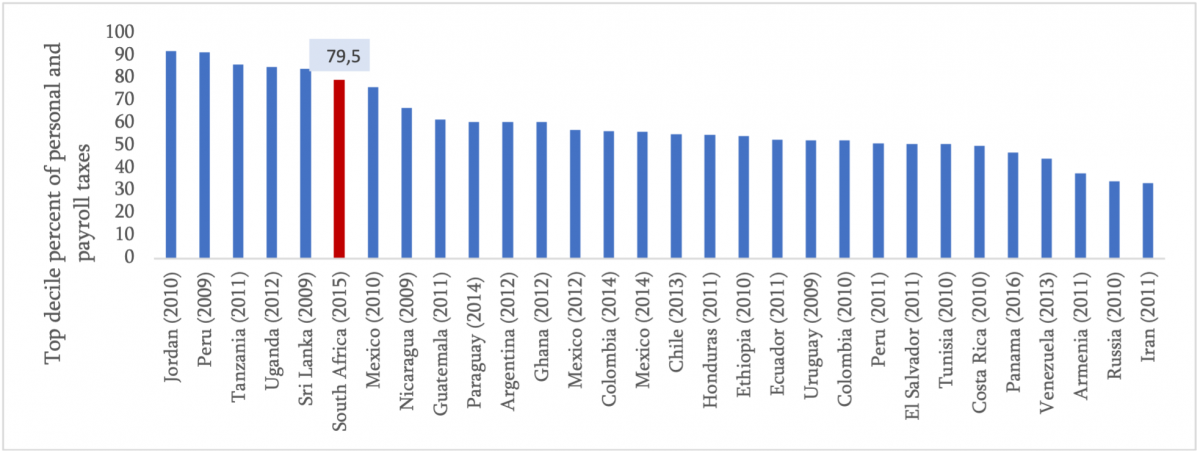
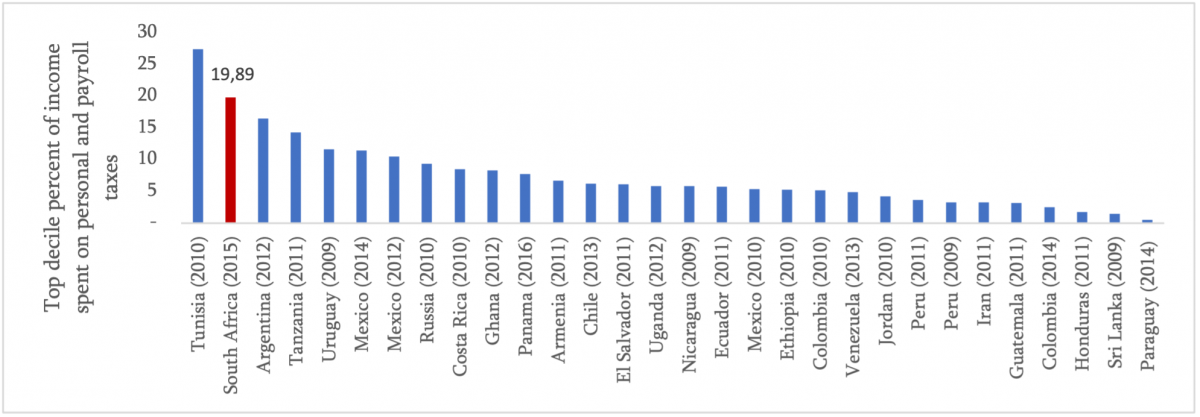
South Africa’s top decile pays 79.5% of the Personal and Payroll taxes. This is strongly concentrated in the top decile compared with other countries assessed by the CEQ Institute, but still lower than Jordan, Peru, Tanzania, Uganda, and Sri Lanka (Figure 1a). Unusual, however, is the incidence[17] of the tax in the top decile. South Africa’s top decile spends 20% of its market income on personal and payroll tax, second only to Tunisia in 2010 at 27%. (Figure 1b).
Figure 1: Personal and Payroll tax, a. top decile’s concentration (top panel) and b. top decile’s incidence (bottom panel)
|
Source: authors’ calculations based on the CEQ Standard Indicators (April 2021), 2021 Budget Review and the World Development Indicators. |
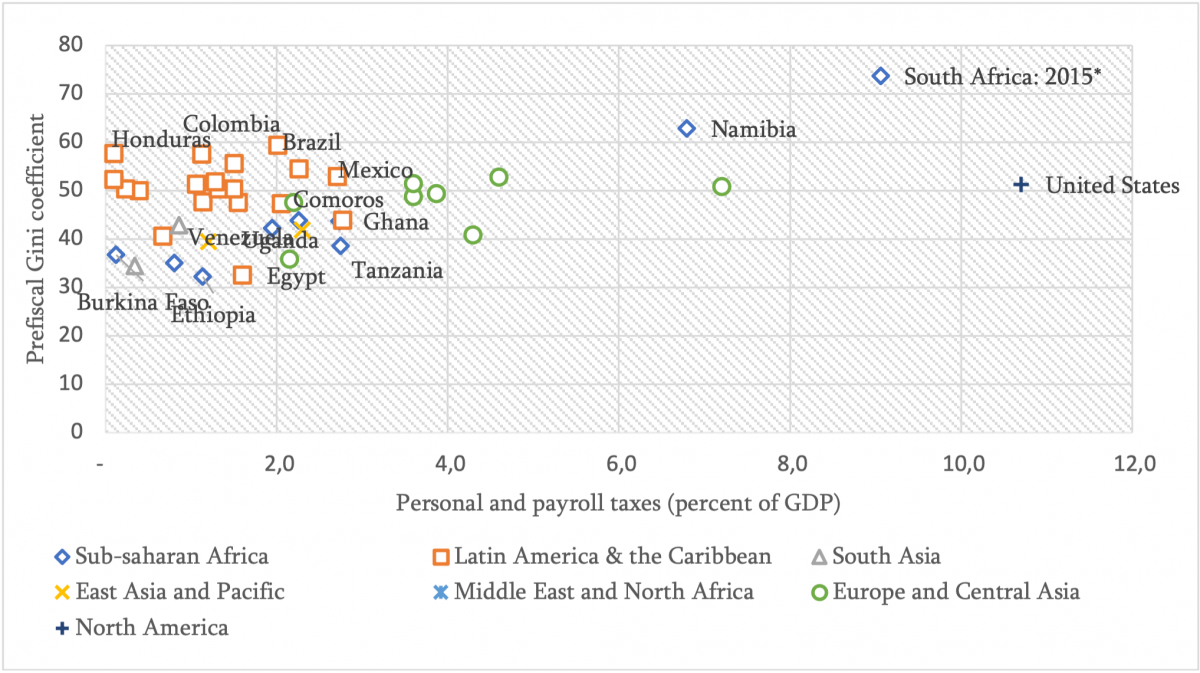
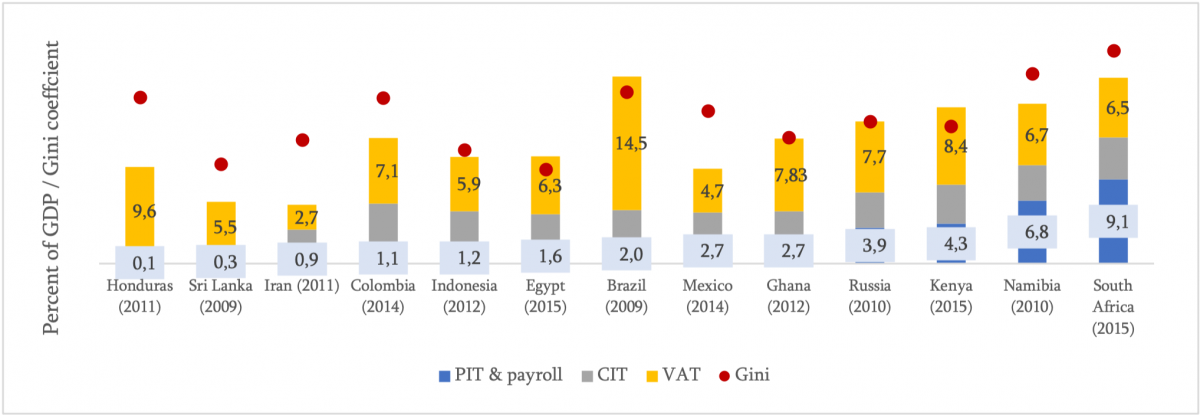
If we examine this on a graph that also shows levels of inequality prior to fiscal intervention (pre-fiscal inequality in the terminology of the CEQI), we see that while there are many Latin America and Caribbean countries with similarly high levels of inequality, they don’t use direct taxes as a means of redistribution in the same way South Africa does (Figure 2a). Many - such as Brazil, Colombia, and Honduras – instead use VAT as their primary tax collection (Figure 2a, 2b).
Figure 2: Size of personal and payroll taxes (percent of GDP) and Gini coefficient, a. Scatterplot of all countries (top panel) b. Bar chart of a subsample of countries (bottom panel)
Results
Once we have a set of results for all three years, we are able to calculate the standard set of indicators of poverty and inequality, (such as the poverty headcount and the Gini coefficient), of fiscal impact (such as the total fiscal impact on poverty and inequality reduction), and of the specific contribution that the Personal Income Tax makes to inequality reduction and to capacity of the fiscus to spend.
Income inequality
The results of the income simulation are an increase in market-income inequality from a Gini of 76.8 in 2011, to 77.3 in 2015, to 77.8 in 2020. In 2011, the richest 10% of South Africans earned 62.7% of total market income, and in our simulation this increased slightly to 64.3% in 2020, while the share of income earned by the remaining 90% of South Africans reduced from 37.3% to 35.7%. Remember that while this is based on actual consumption data in Period 1 (2011 to 2015), for Period 2 (2015 to 2020) this is an assumption - we simply apply the trend that we observed in Period 1.
Table 2: Market income: 2011 to 2020
|
|
Total (R, billion) |
Percent |
||||
|
Decile |
2011 |
2015 |
2020 |
2011 |
2015 |
2020 |
|
1 |
0.0 |
0.0 |
0.0 |
0.0 |
0.0 |
0.0 |
|
2 |
0.4 |
0.5 |
0.6 |
0.0 |
0.0 |
0.0 |
|
3 |
5.8 |
7.2 |
8.5 |
0.3 |
0.3 |
0.3 |
|
4 |
15.7 |
19.6 |
23.1 |
0.9 |
0.9 |
0.9 |
|
5 |
29.8 |
37.4 |
44.0 |
1.8 |
1.7 |
1.7 |
|
6 |
49.2 |
61.9 |
73.0 |
3.0 |
2.9 |
2.8 |
|
7 |
81.9 |
102.7 |
121.5 |
4.9 |
4.8 |
4.7 |
|
8 |
143.5 |
178.9 |
213.1 |
8.6 |
8.4 |
8.2 |
|
9 |
293.2 |
370.4 |
447.5 |
17.7 |
17.3 |
17.1 |
|
10 |
1039.6 |
1359.2 |
1681.0 |
62.7 |
63.6 |
64.3 |
|
Total |
1659.1 |
2137.9 |
2612.3 |
100.0 |
100.0 |
100.0 |
|
Source: authors' calculations based on the 2014/15 LCS |
||||||
While market-income inequality is highest in 2020, this gap narrows slightly when we subtract the direct taxes from market income (including personal income tax). If we include the layer of direct transfers to market income less direct taxes (social grants, near-cash housing transfers, and free basic services), we find that inequality in 2020 dips below 2015 to the level of 2011, showing that fiscal policy fully compensates for the increase in market inequality.[18]
Figure 4: Inequality at the CEQ Income Concepts, 2011 to 2020
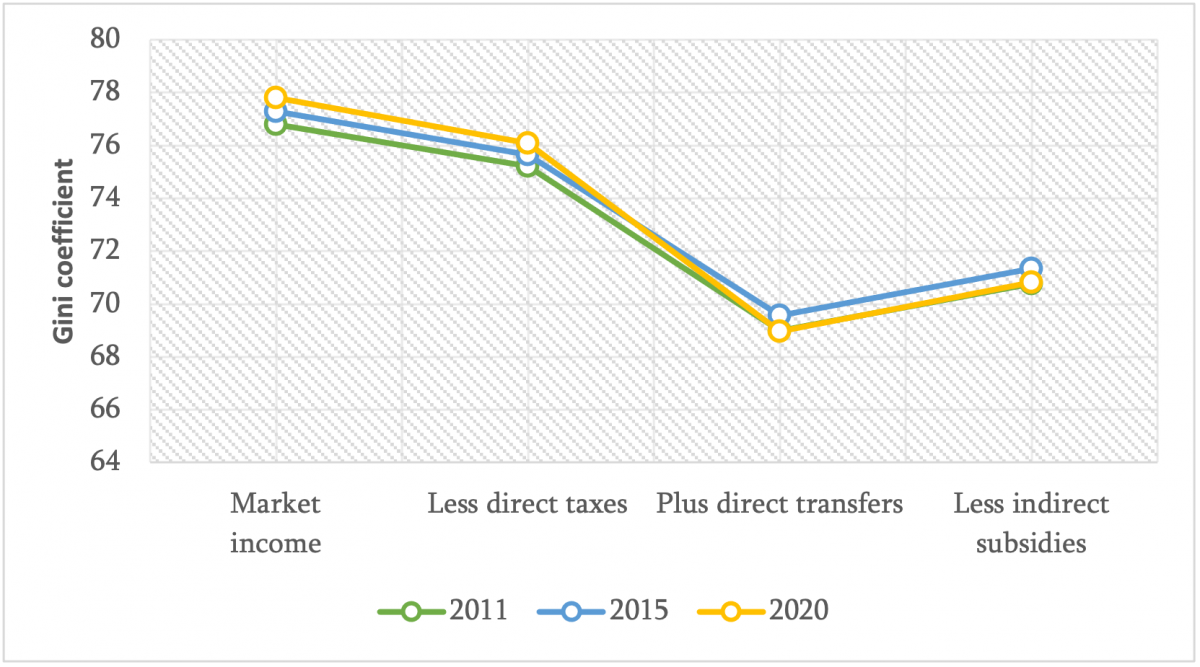
Source: authors' calculations based on the 2014/15 LCS
Progressivity
A comparison of the concentration coefficients and the Kakwani Index (Table 4) allow us to get a sense of the tension between absolute changes to inequality, versus changes relative to the income distribution. The concentration coefficients show that the income tax is becoming slightly more concentrated among the upper deciles over time, as we would expect given the rate changes. However when we take the underlying distribution of income into account (that is, the fact that inequality in market income is increasing over time as shown in Table 2), we find that income tax has actually reduced in progressivity from 2011 to 2020 (measured by the Kakwani Index at market income). This means that while the upper deciles are paying more in absolute terms, their income has increased more than their income-tax payments. They are therefore paying slightly less as a share of income.
Table 3: Income tax progressivity over time (market income)
|
Indicator (market income) |
2011 |
2015 |
2020 |
|
Concentration coefficient |
0.926 |
0.926 |
0.927 |
|
Kakwani Index |
0.158 |
0.153 |
0.149 |
|
Source: authors' calculations based on the 2014/15 LCS |
|||
Marginal impacts on poverty and inequality
Using the CEQ’s Marginal Impacts indicator, we can estimate by exactly how much the PIT reduces inequality. The indicator works by calculating the difference in the Gini coefficient with and without income tax
We see from Figure 5 that the income tax is having to work harder over time to reduce inequality. Its impact goes from a reduction of 1.53 (in 2011) to 1.75 Gini points (in our 2020 simulation).
Figure 5: Impacts of the PIT on inequality reduction (left panel)
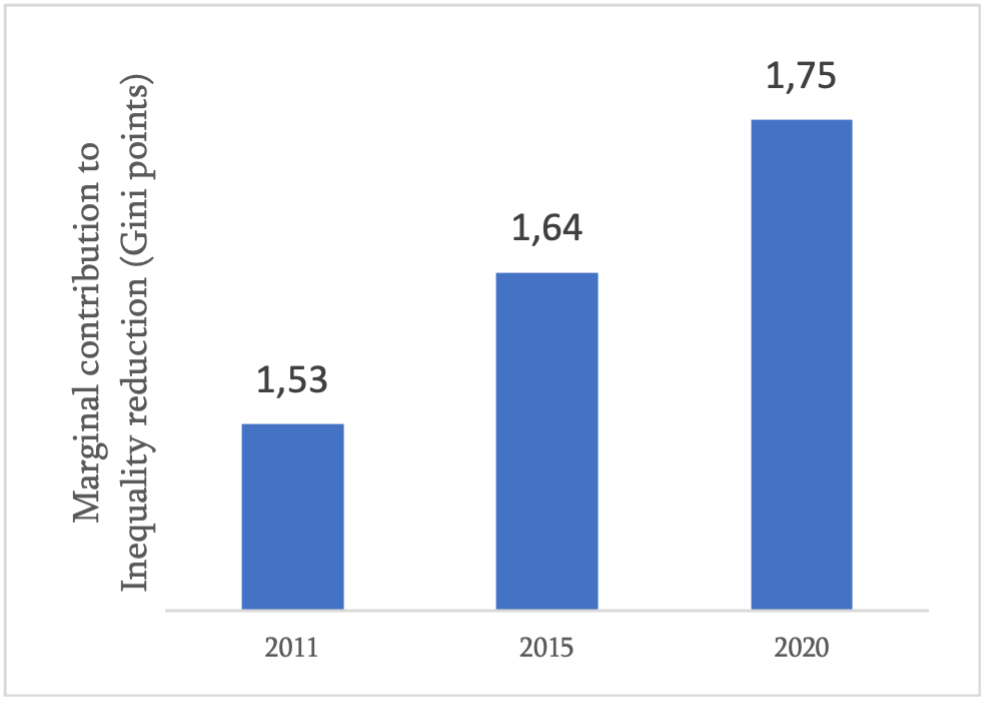
Source: authors’ calculations based on 2014/15 LCS
Conclusion
South Africa has one of the most progressive and sizeable income taxes in the world. The changes to the fiscal system implemented since 2011 improve tax equity, reduce inequality, and raise funds for the fiscus. These funds are spent on sizeable social grants programmes that have a large impact on the poor – in 2015 they reduced poverty by 6 percentage points at the Upper-Bound Poverty Line (3.3 million individuals).
Nonetheless, despite measures to increase the rates, the simulated increase in inequality (based on the trend from 2011 to 2015) results in a smaller increase in income tax paid by the upper deciles relative to the increase in their incomes.
While we do not take into account the changes due to the COVID-19 pandemic here, it is likely that this result has been exacerbated. The increase in the concentration of income tax in the upper deciles, in absolute terms, appears to be less than that required to counter the rising levels of inequality, based on distributional trends in the growth of incomes between 2011 and 2015.
This suggests that for as long as this trend in rising market inequality continues, South Africa is correct to continue to increase the progressivity of income tax. But it also means that this tax cannot be relied upon as a primary tool for countering inequality in the long term. The trend in income inequality suggests that the redistributive impact of the tax today will not have sufficient impact on future market levels of inequality.
We need to find more effective ways of reducing inequality in the longer term, such as reducing our structural skills shortages, and improving our public education system.
References
Businesstech, (2021). “South Africa is losing thousands of millionaires”. 5 January. Last accessed 26th April 2021.
Cohen, T. (2021). “Here’s why a wealth tax is a stunningly poor idea for South Africa”. Daily Maverick, 24thJanuary.
Davis, D. (2021). “The great wealth tax debate: Heed the 60-million South Africans, rather than the 100,000 wealthiest.” Daily Maverick, 7th February.
Forslund, D. (2021) “The great wealth tax debate: How to fund a constitutional state”. Daily Maverick, 3rdFebruary.
Goldman, M., Jellema, J., & Woolard, I. (2021). “Inequality measurements: the impact of a correction for missing top incomes in a South African household survey.” EU-AFD Research Facility on Inequalities: Policy Dialogues No 45, March 2021.
Goldman, M., Woolard, I. & Jellema, J. (2020). “The Impact of Taxes and Transfers on Poverty and Income Distribution in South Africa 2014/2015”. French Development Agency: Research Paper No. 198, December 2020.
Gonçalves, P. (2020). “Over 4000 wealthy South Africans have left the country”. International Investment, 20th October.
KPMG (no date). Corporate tax rates table. [https://home.kpmg/za/, Last accessed: 17 June 2022]
Lustig, N. 2018. Commitment to Equity Handbook. Washington DC.: Brookings Institution Press, October 30.
Khumalo, S. 2019. “Kieswetter wants to steer SARS out of 'tragic' four years”. Fin24. [accessed 29th April 2021.]
Sabitova, N., & Dyudina, M. (2015). Income Taxation as a Tool of Income Redistribution. Mediterranean Journal of Social Sciences, 6(1 S3), 174. DOI: 10.5901/mjss.2015.v6n1s3p174Snyders, K. & Mohan, S. (2017). “Articles: Is the New Super Tax a Tax on Wealth”. BDO South Africa.
The Davis Tax Committee, The Davis Tax Committee to the Business Day. 17 April 2018. Letter. [Accessed 29th April 2021]. taxcom.org.za.
Visser, A. (2017). “Wasted tax money affects willingness to pay”. South African Institute of Tax Professionals.
Wilkinson, R.G., & Pickett, K., (2009). “The Spirit Level: Why More Equal Societies Almost Always Do Better.” Penguin Books.
[1] Goldman, Woolard and Jellema, 2020.
[2] Note that the VAT appears regressive compared to Market Income but is neutral at Disposable Income, with any deviations from that neutrality the result of exempt and zero-rated goods.
[3] See, for example, Businesstech (2021), and Gonçalvez (2020).
[4] Wilkinson & Pickett, 2009.
[5] Cohen, T, 2021
[6] According to Businesstech (2021), South Africa has lost 8600 dollar millionaires since 2017. While it is true that the stated motivation for the decision of South African billionaires to leave the country is partly based on high levels of taxation, they also stated many other aspects such as crime, quality of life and education – many of which would be improved by a better functioning state and lower levels of inequality, both of which higher taxation is designed to achieve.
[7] Davis (2021) and Forslund (2021) argued that he did not take into account South Africa’s historical legacies and current inequalities, and he was criticised for the sloppiness of the definitions that he used, among others, incorrectly calling the higher tax bracket a “wealth tax”.
[8] Sabitova & Dyudina, 2015
[9] Visser, 2017.
[10] Khumalo, 2019.
[11] The Davis Tax Committee, 2018.
[12] Note that here we compare only with those countries that have already undergone a CEQ Assessment. This is limited to developing countries, and the United States. A CEQ Assessment is a type of fiscal incidence analysis, which measures the impact of taxes and transfers on poverty and inequality. See https://commitmentoequity.org/ for more information, and Lustig (2018) for details of how to conduct a CEQ Assessment.
[13] The 2015 model is an update of the architecture developed for a 2014/15 CEQ Assessment of South Africa, generated using a combination of the Living Conditions Survey microdata and administrative and budget data.
[14] The Kakwani Index is a summary statistic of progressivity. It is calculated for transfers by subtracting the concentration coefficient from the Gini coefficient of a reference income, and for taxes by subtracting the Gini coefficient from the concentration coefficient. A higher number indicates greater progressivity.
[15] GDP stands for Gross Domestic Product and is an indicator of the amount of economic activity in a country. It is a measure of the value added created through the production of goods and services in a country during a certain period.
[16] The rate decreased from 34.55 to 28% in 2013 (KPMG, undated).
[17] Incidence refers to the size of the tax as a share of income.
[18] This should be interpreted with caution. The near-cash housing transfers represent an estimate of the market valuation of an individual’s house, rather than a cash injection, and the Free Basic Services represent an upper bound simulation of the impact of the programme, were the local sphere of government to be applying the programme as intended by the national sphere. For more details on the methodology for modeling each fiscal instrument see Goldman, Woolard & Jellema (2020)
Download article
Post a commentary
This comment facility is intended for considered commentaries to stimulate substantive debate. Comments may be screened by an editor before they appear online. To comment one must be registered and logged in.
This comment facility is intended for considered commentaries to stimulate substantive debate. Comments may be screened by an editor before they appear online. Please view "Submitting a commentary" for more information.