Inequality through the prism of the pandemic
Inequality through the prism of the pandemic[1]
Muna Shifa, Anda David and Murray Leibbrandt
Abstract
The COVID-19 pandemic has exposed significant inequalities in terms of capacities to cope with such a major shock. This article uses two data sources in South Africa - the 2018 General Household Survey and the 2016 Community Survey – to develop a set of indicators to show households’ ability to cope with lockdowns, and the extent to which they are vulnerable to COVID-19. These indicators and their aggregate indices allow us to profile lockdown capacity and COVID vulnerability at the national, provincial, and municipal levels as well providing an urban/rural breakdown. There are stark spatial inequalities in both the ability to comply with lockdowns and in COVID vulnerability, and disturbingly strong correlations between the two. This has implications for budget allocations in response to the pandemic, especially as some relief funding has been and will be apportioned according to municipal need.[2]
Introduction
In early April 2020 half of humanity was in lockdown in response to the COVID-19 pandemic. Faced with such a novel situation, most governments chose to protect their citizens by temporarily imposing strict restrictions on mobility and by appealing to their sense of solidarity. At the beginning of the pandemic and the lockdowns, everyone faced the same limitations and was considered equally vulnerable to the virus. Indeed, in the early days of the spread of the virus, those infected were international travellers who often represented a privileged class. However, as the epidemic became a pandemic, it became evident that the virus did not affect everyone equally, and that not everyone had the means to cope with extended lockdowns.[3]
The COVID-19 pandemic has exposed and reinforced socio-economic inequalities within and between countries. Poverty is often associated with weaker health, resulting in higher vulnerability to Covid-19 due to comorbidities. In addition, poor people may be more exposed to the virus because their jobs are often in sectors where remote working is not possible, they have less access to facilities such as water and sanitation, and they live in more populous areas. Thus, the initial level of inequality can determine the level of exposure to the virus and its lethality.[4]
Across the world, interventions such as social distancing and hand hygiene are recommended to break the virus transmission cycle. However, compliance with these guidelines depends on appropriate home-environment and personal behavioural responses.[5]
Spatial inequality can increase the vulnerability of a country to a crisis such as COVID-19. While remote and isolated areas may benefit from being less exposed to contagion, the lack of access to basic services and health facilities may actually increase fatalities in these areas as the infection spreads. Inequality also affects government’s ability to respond to the pandemic.
High inequality and polarization have been shown to negatively affect political institutions and trust in the government, thus limiting consensus on policies to respond to the pandemic and ensure compliance by citizens without harsh enforcement.[6]
This article uses survey data to profile the prevailing circumstances of individuals and households across South Africa confronted with the virus. We analyse the vulnerability of provinces and municipalities based on the living conditions of their populations in order to describe the prevailing inequalities in the capacity to respond to the presence of the virus.
We examine whether poorer households are less able to comply with strict lockdown policies and are more vulnerable to COVID-19 infection due to their living conditions.
Our findings indicate stark inequalities in South Africa in terms of ability to comply with lockdown regulations, as well as vulnerability to the virus. There are also disturbingly strong correlations between low capacity and high vulnerability.
Regardless of where poor households live, they are less likely to be able to protect themselves from the virus and to comply with strict lockdowns.
Data and measurement
We use data from two surveys: the 2018 General Household Survey (GHS) and the 2016 Community Survey (CS).
The GHS is a nationally representative sample of approximately 24,726 households (Stats SA, 2019). The sample size of the CS is 984,627 Dwelling Units (DUs). It effectively provides representative estimates at the local municipality level. While the CS is used to generate results at provincial and local municipality levels, the GHS is used to obtain estimates at provincial and national levels.
Lockdown capacity and vulnerability measurements
Following Jones et al (2020), we use the following five indicators for calculating the lockdown capacity index for South Africa:
- Access to electricity
- Access to safe drinking water
- Access to a safe toilet
- TV or radio in the household
- At least one person in the house employed or the household is food secure
Access to safe drinking water indicates water from piped (tap) water in the dwelling or on-site. Access to a safe toilet indicates that the household has access to a toilet facility that is not shared with other households. Data on all the five indicators are available in the 2018 GHS.
Apart from the employment information, the data is also available in the 2016 CS. We use a food security indicator instead of the employment indicator when calculating the lockdown capacity index based on the CS. The food insecurity indicators are measured based on survey participants responses to the following questions: “In the past 12 months, did this household run out of money to buy food?” and “Has this happened for five or more days in the past 30 days?” Because a significant proportion of workers (63%) in South Africa cannot be regarded as essential workers, nor could they work from home,[7] the food security indicator may provide a better indication of households’ access to regular income. We compared estimates of the lockdown capacity index using the food security indicator with those based on the employment indicator in the GHS. The results are similar.
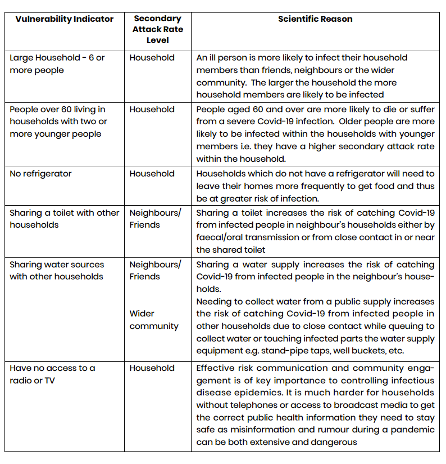
The vulnerability indicators identify households at higher risk of contracting Covid-19 infection due to their living conditions. While lockdown and social distancing policies may minimize the risk of infection outside the household, the secondary attack rate (the proportion of people exposed to an infected person) varies depending on the living circumstances of the individual. Gordon et al (2020) suggest nine indicators to measure vulnerability to Covid-19 infection. These indicators are based on how the virus is transmitted and measure an individual’s capacity to follow WHO recommendations on regular hand washing, social distancing, and access to information from trusted sources.
We used six of the indicators that can be measured using both the GHS and CS datasets. Table 1 provides the vulnerability indicators and the scientific justification for using each one. The lockdown capacity indicators and the vulnerability indicators overlap somewhat with access to safe water, safe toilets, and information being part of bo
Table 1: Vulnerability to Covid-19 infection indicators[8]
Lockdown capacity index
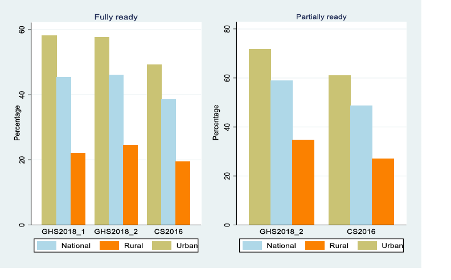
Estimates based on both sets of data suggest that less than half - about 38%-46% - of the population have access to all six lockdown capacity indicators. We found a marked difference in the capacity to adhere to lockdown regulations between urban and rural areas.
Except for sanitation, the estimates based on the CS data for all indicators are not substantially different from estimates based on the GHS data.
Fig 1: Lockdown readiness index. National, rural, urban.[9]
The two data sets both show that the three provinces with the highest percentage of the population most able to comply with lockdown rules are the Western Cape, Gauteng, and Free State, while the bottom three are North West, Limpopo, and the Eastern Cape.
We used CS data to assess the ability to comply with lockdown regulations across municipalities. The results show considerable inequality across municipalities and within provinces. The proportion of the population most able to comply with lockdowns ranges from 68% to 77% in the top 10 municipalities (Kou-Kamma, Hessequa, Karoo, Karoo-Hoogland, Matzikama, Renosterberg, Mossel Bay, Kannaland, Kgatelopele, Drakenstein, and Prince Albert), all in the Western or Northern Cape with the exception of Kou-Kamma which is in the Eastern Cape. In the 10 least prepared municipalities, only between 0.7% to 4% were able to comply with lockdowns. These were Joe Morolong, Umhlabuyalingana, Big 5 Hlabisa, Ntabankulu, Nongoma, Ratlou, Nyandeni, Ngquza Hill, Mbizana, and Mbhashe, all in either the Eastern Cape or KwaZulu-Natal, except for Joe Morolong and Ratlou, in the Northern Cape and North West respectively.
The percentage of individuals who lived in a household that reported being food insecure ranges from 51% to 62% in Ratlou, Joe Morolong, Mfolozi, Impendle, Ezinqoleni, Imbabazane, Nkandla, and Mpofana municipalities, all in KZN except for the first two. In contrast, the figure is less than 10% in Kou-Kamma, Karoo, Karoo-Hoogland, Hessequa, Kannaland and Maletswai municipalities. The proportion of the population that reported being food insecure for five days or more in the 30 days prior to the survey was 35% and above in local municipalities such as Imbabazane, Mfolozi, Ratlou, Joe Morolong, Hlabisa, Nkandla, and Mpofana. High-level food insecurity is also reported in some local municipalities in relatively better off provinces. For example, about 35% of the population in Laingsburg in the Western Cape is food insecure. Similarly, between 25-27% reported food insecurity in Merafong City and Lesedi municipalities in Gauteng province.
The pre- COVID-19 figures on food insecurity are alarming enough. Given that poor households have little or no savings, the evidence is that strict lockdown policies have led to more hunger and poor nutrition outcomes. Recent evidence from the NIDSCRAM survey shows that food insecurity was exacerbated during the lockdown. Some 47% of adults reported their households faced food insecurity.[10]
Overall, less than half the population in South Africa lives under conditions that allow them to adhere to a strict lockdown policy. Disaggregated figures show marked differences in the level of capacity across the country. This is true even within provinces that were more ready on average.
Vulnerability indicators
The estimates obtained based on the two datasets are similar except for the toilet sharing and household size indicators. In both cases, about 21% of the population reside in households comprising at least one older adult (age >60) and two younger individuals. Around 15% of the population do not have access to a refrigerator, while 8% have no access to a television or radio. The percentage of the population living in a family of six or more is greater in rural than in urban areas - 51% in rural areas and 30% in urban areas.
In terms of vulnerability indicators, there are significant variations across provinces. For instance, the proportion of the population sharing water is less than 10% in Gauteng and Western Cape, whereas it’s more than half in Limpopo and Eastern Cape. Likewise, a relatively higher proportion of the population in Eastern Cape has no access to a refrigerator (25-29%), while this figure is only 8% in the Western Cape.
There are also large differences in the degree of vulnerability across municipalities. The proportion of the population living in a family of six or more is 60% or more in the KZN municipalities of Hlabisa, Nongoma, Indaka and Dannhauser. The proportion using shared toilet facilities is between 50% and 68% in seven local municipalities, two in the Free State, two in KZN, two in Limpopo, and one in the Eastern Cape.[11] In 11 local municipalities, it’s less than 10%.[12]
At least half the households in 75 municipalities share water with others, and this figure is as high as 95% in Mbizana, Ngquza Hill, Mbhashe, Nyandeni, and Port St Johns, all in the Eastern Cape. Over a quarter of the population had no access to either TV or radio in nine local municipalities (Ntabankulu, Elundini, Mbizana, Vulamehlo, Port St Johns in the Eastern Cape, and Msinga, Umzimvubu, Ndwedwe, and Ubuhlebezwe in KZN.)
Intensity of vulnerability
We also examined the incidence of multiple vulnerabilities as this is related to the risk of infection. We constructed a vulnerability index, weighing each indicator equally. We also assessed the risks of infection by the number of vulnerabilities each person faced.
Figure 2 shows the average vulnerability score broken down by rural and urban areas. Average vulnerability is higher in rural than urban areas, with the national average lying between the two as the weighted average.
Fig 2: Average vulnerability scores, nationally and by urban and rural areas[13]
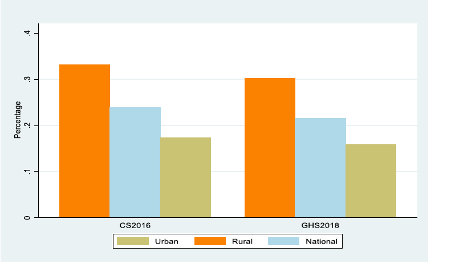
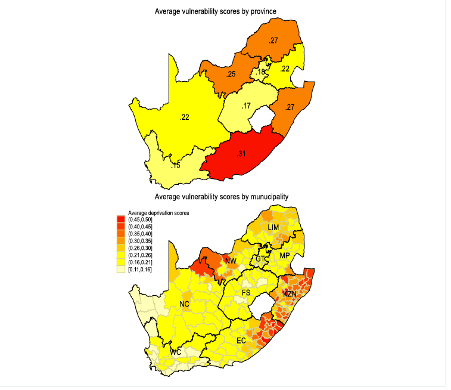
Figure 3 shows the average vulnerability scores by province and municipality. The most vulnerable province is the Eastern Cape followed by Limpopo and KwaZulu-Natal.
The municipality level estimates, however, show significant variations within provinces. Indeed, if the provincial level analysis shows the Eastern Cape as having the highest vulnerability score, at the municipal level, those with high vulnerability scores can also be found in KwaZulu-Natal, North West and Northern Cape
Fig 3: Average vulnerability scores by province and municipality [14]
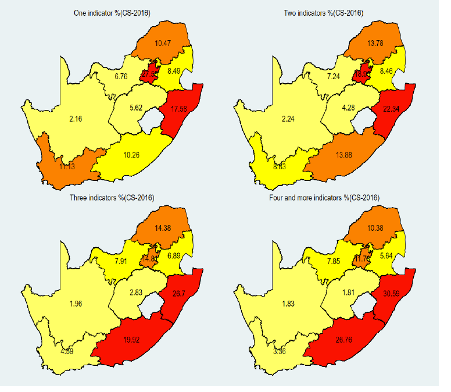
About 30% of the population is not vulnerable in any of the indicators. The proportion of the population vulnerable to infection in only one indicator is 32%, while close to 23% of the population are vulnerable to infection due to two of them. The intensity of vulnerability is higher in rural areas than in urban areas.
Vulnerability to infection due to three or more indicators varies in most provinces. However, uniformly, the intensity of vulnerability is highest in the Eastern Cape, Limpopo, KwaZulu-Natal and North West. It is between 30-37% in 17 municipalities, mainly located in KwaZulu-Natal and Eastern Cape. On the other hand, the figure is less than 5% for 19 municipalities largely located in the Western Cape and Northern Cape.
Provincial vulnerability shares
Our previous analysis shows large differences in levels of vulnerability across provinces. But population size varies. The population share for KwaZulu-Natal and Gauteng is 20% and 24% respectively, while for Eastern Cape it’s 13%. On the other hand, the population share for Northern Cape is only 2%. Thus, it is important to consider the contribution of each province to the overall vulnerability measure in the country.
In terms of the proportion of population vulnerable to infection due to two or more indicators, the Eastern Cape, Limpopo, KwaZulu-Natal and Gauteng provinces are the highest.
In the Eastern Cape and KwaZulu-Natal this is due both to high provincial intensity of vulnerability combined with large shares of the national population. Limpopo does not have such a large population share (10%) but the intensity of vulnerability within this population is so high that it still has a high national share.
Fig 4: Relative share of population vulnerable to Covid19 infection by province [15]
Municipalities
The relative share of the population vulnerable to Covid-19 infection due to two or more indicators is higher in municipalities located in Gauteng, Eastern Cape, Limpopo, KwaZulu-Natal and Mpumalanga. Our findings draw two important conclusions: first, even in the least vulnerable provinces, there are local areas that contain sizeable shares of the national population that are highly vulnerable; second, even in provinces with high vulnerability, the combination of high vulnerability with large population share is quite localized
The wealth effect
Socio-economic factors associated with vulnerability to infection and the ability of individuals to deal with severe lockdowns are often a reflection of wealth-related status.[16]
We constructed a wealth/asset index that shows the share of wealth for the poorest 20% of the population is less than 3%, while the figure for the richest 10% of the population is 39%.
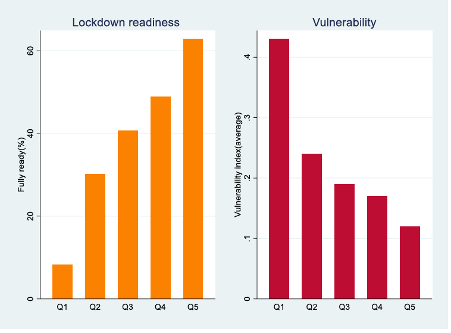
In terms of capacity to endure lockdowns and vulnerability to infection by wealth, only 8% of the population in the poorest quintile can meet lockdown requirements, while the figure for the richest quintile is 63%. Likewise, a relatively large percentage of the poorest quintile is vulnerable to the virus due to multiple factors – 29%, compared with just 3% of the richest quintile.
Figure 5: National lockdown readiness and vulnerability indices by wealth quintile [17]
At a provincial level, lockdown capacity is also low for those in the poorest quintile: 3% in the Eastern Cape and 4% in Gauteng. It is relatively higher in Mpumalanga (15%) and Limpopo (14%). However, only about half of those in the richest quintile are fully able to comply with lockdowns in Mpumalanga, Limpopo and North West provinces. Moreover, the proportion of the population in the richest quintile is the lowest in the Eastern Cape and Limpopo, while a relatively large percentage of the population (nearly a third) is concentrated in the poorest quintile. In contrast, only 4% of people in the Western Cape and 8% in Gauteng are in the poorest quintile.
There is a similar pattern in the vulnerability index. It is higher for those in the poorest quintile in all the provinces, but relatively lower in Mpumalanga, Limpopo and Free State.
The proportion of people in the lowest wealth quintile vulnerable to infection due to four or more vulnerability factors is 34% and 30% in Western Cape and Gauteng, respectively, the two wealthiest provinces. These figures drop to 0.1% for those in the richest quintiles in both provinces.
Inequalities within provinces also play a role. Inequity in lockdown capacity is the highest in the Eastern Cape, followed by KwaZulu-Natal and North West provinces. In contrast, within-province inequality in lockdown readiness is lower in the Free State and Western Cape.
With respect to the vulnerability index, Eastern Cape, KwaZulu-Natal and Western Cape are among those with relatively higher levels of inequality. In contrast, inequality in vulnerability to the virus is the lowest in Limpopo followed by Mpumalanga and Free State.
We also find a significant wealth effect across municipalities.
Overall, our findings suggest living conditions of poorer households make them more vulnerable to COVID-19 infection through their exposure to an infected person. Poorer households are also less able to cope with strict lockdowns.
Conclusion
The differences in capacity for lockdowns and vulnerability across the country are stark. There are strong correlations between low access to assets, low capacity to adhere to lockdowns, and high vulnerability. Those with the least resources find it most difficult to conform to lockdown regulations and yet are most COVID-vulnerable.
This is disturbing. It is vital that policies to contain the pandemic be tailored to the uneven ways it affects different parts – and different wealth distributions – of the country. This requires combining the analysis of these indices with fine-grained epidemiological data.
There are also marked spatial inequalities in lockdown capacity and in COVID vulnerabilities. The municipal analysis shows this is true even within provinces that have high aggregate readiness and low aggregate vulnerability. Understanding the effects of spatial inequality is critical in targeting COVID policy responses, even if policy is implemented as a set of focussed interventions by various ministries.
At face value, “different indicators of vulnerability to COVID-19 infection require different policy solutions, e.g. providing a household with soap and providing an infected person from an overcrowded household somewhere isolated and safe to recover require different kinds of public service interventions”.[18]
Budget allocations usually operate at a higher level of aggregation than an indicator-by-indicator approach. However, this analysis of areas of vulnerability can help inform allocations in terms of the municipal equitable share, which includes “a basic services component that helps municipalities provide free basic water, sanitation, electricity and refuse removal services to households that fall below an affordability threshold.”That threshold is a household income of R2300 a month, and 59% of households, according to StatsSA fall below this.[19]
In the June 2020 COVID emergency budget, Finance Minister Tito Mboweni allocated an additional R11 billion to local government through the equitable share. He described it as being “at the heart of our response to the pandemic”.
The use of the equitable share formula in allocating funds to local government for COVID relief makes a policy case for the kind of indicator development that is our focus. The free basic services that are considered in the equitable share formula are closely aligned to the indictors we have used to ascertain COVID readiness and vulnerability.
Recently government has spoken of a direct district development approach to policy. Our indicators have shown that within all provinces, there are municipalities with intense vulnerabilities some of which contain large populations.
There are pernicious correlations between prevailing inequalities, lockdown capacity, and COVID vulnerability across the length and breadth of the country.
References
Agley, J (2020): Assessing changes in US public trust in science amid the Covid-19 pandemic; Public Health
Brown, CS and Ravallion, M (2020): Inequality and the Coronavirus: Socioeconomic Covariates of Behavioural Responses and Viral Outcomes across US Counties (no. w27549); National Bureau of Economic Research
Brown, CS, Ravallion, M and Van de Walle, D (2020): Can the World’s Poor Protect Themselves from the new Coronavirus (no. w27200); NBER
Gordon, D, Fonta, C, Grieve, T, Harris, R, Muguni, B, Zhang, M, Dejene M, Mekonen,Y, Sanchez, A,L, Brewer, T, Heyman, J, Leibbrandt, M, Nandy, S, Chung, R Ekbrand, H, Hallerod, H, Najera, H: Who is most vulnerable to catching Covid-19 and where do they live? Bristol Poverty Institute, University of Bristol; mimeo; June 2020
Kerr, A and Thornton, A: Essential workers, working from home and job loss vulnerability; DataFirst Technical Paper 41, University of Cape Town.
National Treasury (2016): Budget Review, Annexure W1.
Resnick, D (2020): Trust in science and in government plays a crucial role in Covid-19 response; IFPRI blog
Statistics SA (2016): Community Survey, 2016; Stats Release PO301 (Pretoria)
Statistics SA (2019): General Household Survey, 2018, Stats Release PO318 (Pretoria)
Statistics SA (2019): Inequality Trends in South Africa: a Multidimensional Diagnostic of Inequality.
[1] This article is based on a paper produced for the African Centre of Excellence for Inequality Research (ACEI); Working Paper No. 5, October 2020.
[2] Acknowledgments: The authors gratefully acknowledge funding for this research from the Agence Française de Développement through the EU-AFD Research Facility in Inequalities, a program funded by the European Union.
[3] Brown et al, 2020
[4] Gordon et al, 2020
[5] Brown & Ravallion, 2020; Brown, et al., 2020
[6] Resnick, 2020; Agley, 2020
[7] Kerr and Thornton, 2020
[8] Gordon et al, 2020
[9] Source: own estimates using data from GHS (2018) and CS (2016)
[10] Wills et al, 2020
[11] They are Naledi-FS, Tokologo, Mandeni, Ntambanana, Musina, Mookgopong, and Camdeboo.
[12] These are Tsolwana, Kou-Kamma, Baviaans, Ikwezi and Blue Crane in the Eastern Cape, Ubuntu, Kareeberg, Richtersveld and Nama Khoi in the Northern Cape, and Umuziwabantu and Ezinqoleni in KZN.
[13] Own estimates from GHS (2018) and CS (2016) data
[14] Own estimates using GHS (2018) and CS (2016) data
[15] Own estimates using data from CS (2016)
[16] Brown et al 2020
[17] Own estimates using data from CS (2016)
[18] Gordon et al, 2020
[19] National Treasury, 2016
Download article
Post a commentary
This comment facility is intended for considered commentaries to stimulate substantive debate. Comments may be screened by an editor before they appear online. To comment one must be registered and logged in.
This comment facility is intended for considered commentaries to stimulate substantive debate. Comments may be screened by an editor before they appear online. Please view "Submitting a commentary" for more information.