A measure of relief: how the Covid-19 grants have dented poverty and inequality
Additonal authors: Murray Leibbrandt, Wynnona Steyn, and Brenton van Vrede.
| Acknowledgement: A longer version of this paper was published in the WIDER Working Paper Series. The study was originally commissioned under the UNU-WIDER project Southern Africa – Towards Inclusive Economic Development (SA-TIED). The original paper can be found here: https://www.wider.unu.edu/publication/analysis-distributional-effects-covid-19-and-state-led-remedial-measures-south-africa
Econ3x3 thanks UNU-Wider for permission to use it as the basis for this article. |
Introduction
The coronavirus pandemic has been the worst public health emergency in a century. It has also led to severe economic hardship because of lost earnings and jobs. In South Africa, the NIDS-CRAM telephonic survey[1]has provided up-to-date information on the labour market and other social impacts of COVID-19, including hunger. But what has been the impact of the pandemic – and the subsequent social relief measures - on poverty and inequality?
This article is based on our paper[2] that examines the impacts of the first wave of the coronavirus pandemic on poverty and inequality in South Africa. Our timepoint is the second quarter of 2020, the first wave of the pandemic, when a nation-wide lockdown took place. We examined how effectively the social protection system in South Africa was able to mitigate economic losses, taking into account both the benefit system in place before the crisis and the new policy measures introduced in 2020 to mitigate its effects.
We used a tax–benefit microsimulation approach, using a model known as SAMOD, to examine the impacts of the crisis on households’ disposable income, as well as on poverty and inequality. Tax–benefit microsimulation models, used in many other countries, combine a representative survey of incomes and other socioeconomic characteristics of the population with a modelling of tax and benefit rules. They are used to examine the impact of tax–benefit policies on household welfare.
Using SAMOD, as well as data from NIDS-CRAM, we have been able to assess the impact of the crisis on employment and incomes. We have also been able to assess the effects of the new benefits introduced in 2020 to provide households with relief. Specifically, the model allows us to examine the extent to which incomes declined during the crisis, how large a share of the decline was avoided due to the social protection offered by the government, and the resulting impact on poverty and inequality. This has enhanced our understanding of the success of the social protection system in mitigating the economic consequences of the crisis, as well as providing pointers towards further improvements to the benefit system.
The first lockdown: labour market impacts
The first wave of COVID-19 hit South Africa from March/April 2020, and the peak of cases was reported in June. The second wave, which continued into 2021, began to accelerate in December. Since then, we have experienced a third wave that began in mid-2021.
In late March 2020, a lockdown was imposed. This banned all but vital outside movement and closed down many public and workspaces. The most stringent lockdown was in place until the end of April. Clearly this had severe effects on the South African labour market in the first half of 2020.
NIDS-CRAM and the Quarterly Labour Force Survey both provide key insights into the labour market effects of the crisis. NIDS-CRAM is a broadly representative national panel survey that uses computer-assisted telephone interviewing (CATI) to focus on adult individuals’ responses to the pandemic and lockdown. The first wave of interviews was conducted across May and June and collected retrospective employment information for April (the strictest period of lockdown – level 5) and February (before the COVID-19 shock).[3] The other significant source of information comes from the second-quarter round of the Quarterly Labour Force Survey (QLFS).[4] The inability to conduct interviews during the pandemic meant that the release of the second quarter of the survey was delayed and had to be run telephonically.
Both surveys revealed dramatic losses of employment at the height of the national lockdown (NIDS-CRAM estimated 2.2 million jobs lost and the QLFS, 3 million). NIDS-CRAM showed this job loss was especially severe among women[5], the youth, and lower-income workers.[6] The employment effects were also more serious for informal workers[7] who were prohibited from working or trading and simultaneously excluded from some of the initial social support measures introduced in response to the crisis. In addition to this large-scale loss of employment, there was also an unprecedented increase in the number of workers who became furloughed, working zero hours and earning no pay, and in the number who were placed on paid leave[8] and faced reduced earnings.
Policy responses in 2020
South Africa has a well-established tax and benefit system that was already in place prior to the pandemic. This meant it was possible for the government to make swift changes to the existing arrangements to mitigate the effect of the pandemic on people’s incomes. In addition, new policies were introduced to support those not covered by existing policies.
Table 1 lists the tax and benefit policies that are simulated in SAMOD, most of which existed prior to the pandemic (see column 2). One of the first policy responses to be introduced, on 26 March, after the lockdown was declared, was an adjustment to the Unemployment Insurance Fund (UIF) with the establishment of the COVID-19 Temporary Employer/Employee Relief Scheme (TERS).[9] TERS was payable by application of employers to the Department of Labour on behalf of their furloughed workers. In some cases, earnings were suspended, while in others, salaries were reduced. The TERS payment is calculated on a sliding scale, ranging from R3 500 to R6 500 per month.
Moreover, four social benefits were amended from May through to October 2020. These were the Old Age Grant, Disability Grant, Foster Child Grant, and Care Dependency Grant, which were each increased by R250 per month. As the payment systems for these grants were already in place, it was technically straightforward to implement top-ups. The Child Support Grant (CSG) was initially amended in a similar way, with its value being increased by R300 per month in May. However, this was then replaced by a dedicated benefit for the primary caregivers of children in low-income families: each primary caregiver in receipt of CSG for their child(ren) became eligible for a new benefit, called the Caregiver Social Relief of Distress (Caregiver-SRD), paid at R500 per month from May to October 2020. As with the other grants, the CSG payment system was already in place, so it was technically straightforward for the 7.1 million primary caregivers to receive the Caregiver-SRD for themselves in addition to the CSG for their children. This was a particularly important policy change because when the CSG was first introduced in 1998 to replace the former State Maintenance Grant (SMG), the caregiver component of the SMG was not carried through to the CSG, leaving caregivers of working age with no other assistance unless they were disabled.
Another significant response was the introduction of a new benefit called the COVID Social Relief of Distress (COVID-SRD), paid at R350 per month to those of working age who were unemployed and had no income. This was a more difficult group to get onto the payment system and its roll-out was therefore slower than for the other grants. Nevertheless, it was set up at great speed and was iteratively extended until April 2021, and then reinstated from August 2021(its current end date is March 2022). Again, this was an important policy change: prior to the pandemic there had been no social assistance in South Africa for unemployed people of working age unless they were disabled, apart from the short-term Social Relief of Distress, used sparingly in exceptional circumstances such as natural disasters or incarceration of one’s spouse.
All these policy adjustments and innovations were simulated in SAMOD for the relevant months of the first lockdown and are referred to here as ‘the COVID-19 policies’. The COVID-19 policies can be summarized as comprising TERS (applied in April, May, and June), benefit increases (in May and June except for the CSG increase, which was only in May), and new benefits (COVID-SRD in May and June; Caregiver-SRD in June).[10]
Within SAMOD, a separate system (set of tax and benefit rules) was prepared for each of the four months March to June 2020, and in such a way that the COVID-19 policies could be either included or excluded in the running of the model. This enables one to estimate the extent to which poverty and inequality were affected by the lockdown in a scenario that includes the actual policies that were in place in each month, and in a hypothetical scenario with no COVID-19 policies.
Lastly, an important consideration when modelling the policy responses is the extent to which the simulations of the policies reflect actual receipt of the benefits and insurance payments. The two main discrepancies identified were that SAMOD simulated more than twice the number of recipients of the COVID-SRD benefit for May and June. This was likely due to implementation challenges. In contrast, the model simulated fewer recipients of TERS than received the benefit. We did not adjust for this under-simulation, on the basis that it can be assumed that a subset of those who reported earnings in NIDS-CRAM Wave 1 were actually reporting income derived from TERS. As a consequence, the findings about the impact of the COVID-19 policies will be understated with respect to the role of TERS; however, it should not affect results on the combined impact of the shock and all policies on distributional incomes as the income sources are not differentiated.
Table 1: Tax and benefit policies that are included in SAMOD for 2020
|
Tax–benefit policy |
Existed prior to COVID-19? |
Changes introduced due to COVID-19? |
Summary of the changes that were introduced due to COVID-19, if applicable |
|
Old Age Grant (OAG) |
|
|
OAG top-up of R250 in May–October 2020 inclusive |
|
Disability Grant (DG) |
|
|
DG top-up of R250 in May–October 2020 inclusive |
|
Child Support Grant |
|
|
CSG top-up of R300 per child for May 2020 only |
|
Care Dependency Grant (CDG) |
|
|
CDG top-up of R250 in May–October 2020 inclusive |
|
Foster Child Grant (FCG) |
|
|
FCG top-up of R250 in May–October2020 inclusive |
|
Caregiver Social Relief of Distress (Caregiver-SRD) |
X |
New |
A payment of R500 was made to each CSG caregiver (irrespective of number of children) for June–October 2020 inclusive |
|
COVID-19 Social Relief of Distress (COVID-SRD) |
X |
New |
COVID-19 SRD payment of R350 from May 2020 to end of April 2021 |
|
Personal income tax main policy |
|
But not implemented in SAMOD |
A proportion of PAYE (paid to the South African Revenue Service by employers) could be deferred. Tax relief was also introduced for provisional tax (for the self-employed, individuals running their own small businesses with gross income below R100 million). |
|
Income tax rebates |
|
X |
N/A |
|
Income tax on lump sums |
|
X |
N/A |
|
Medical tax credits |
|
X |
N/A |
|
Unemployment Insurance Fund contributions |
|
X |
N/A |
|
Temporary Employer/Employee Relief Scheme |
X |
New |
UIF introduced TERS (or ‘COVID UIF’) payments for furloughed employees in April 2020, which had a minimum payment of R3,500 per month (even if usual salary is less than this) up to R6,500 per month on a sliding scale. |
Note: The Skills Development Levy and the Employment Tax Incentive are not modelled in SAMOD as these concern employers rather than employees. Grant-in-aid and the War Veterans Grant are not simulated due to lack of information in the input dataset with which to model the policy. UIF contributions are simulated in SAMOD but receipt of the main UIF benefits is not modelled due to lack of data on past contributions. CSG was also increased from 1 October 2020 by R10 to R450.
Source: Authors’ compilation.
Findings
Our findings addressed changes in disposable income, poverty, and inequality, and evaluated the extent to which the COVID-19 policies helped protect household incomes and provide support for those already in poverty during the first few months of the pandemic.
We used predictions based on NIDS-CRAM Wave 1 to show the labour market shock caused by the pandemic – in particular the loss of employment and earnings. This modelling reflects predicted outcomes at the height of the crisis and lockdown (April - June 2020) and can be interpreted as a counterfactual showing what poverty and inequality would have been without the Covid-19 policies.
Change in mean disposable income between March and June 2020
Figure 1 shows the distribution of household per capita disposable income[11] by decile for March, April, May, and June 2020, in rands.
Figure 1: Mean monthly household disposable income by decile in March, April, May, and June 2020 (includes pre-COVID-19 and COVID-19 policies)
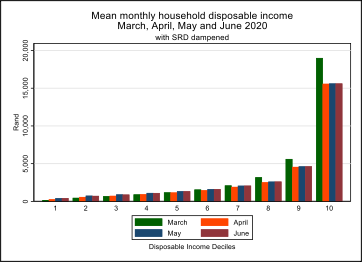
Note: simulated receipt of COVID-SRD benefit was dampened to match actual receipt (applicable to May and June only).
Source: Authors’ analysis of output datasets from SAMOD V7.3-COVID.
Mean disposable income fell for the wealthier deciles and ultimately increased for the poorer deciles. The first column in each decile (in green) shows the situation in March 2020 prior to the shock, while the results for the other three months are based on the shocked input dataset in which those in employment prior to the shock had been assigned different statuses.[12] Here, the most notable change is the reduction in mean monthly household disposable incomes in the top (richest) deciles.
Figure 2 shows the change in mean monthly household disposable income by decile in rands. As can be seen, deciles 7–10 experienced a fall in disposable income in April, May, and June when compared with the baseline in March. The wealthiest (tenth) decile experienced the largest fall in disposable income. In contrast, in May and June, deciles 1–6 saw a rise in disposable income.
Figure 2: Change in mean monthly household disposable income by decile since March in April, May, and June 2020 (includes pre-COVID-19 and COVID-19 policies)
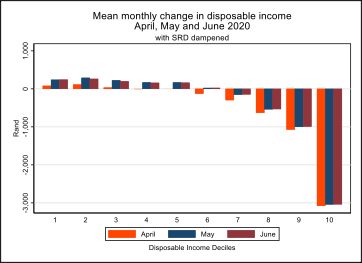
Note: simulated receipt of COVID-SRD benefit was dampened to match actual receipt (applicable to May and June only).
Source: authors’ analysis of output datasets from SAMOD V7.3-COVID.
The increase in disposable income in the lower deciles is small in rand amounts, but when expressed as a percentage of March’s mean disposable incomes the change is striking. This is shown in Figure 3, which shows that the mean disposable income of those in the first (poorest) decile increased by just over 100% in April and by almost 200% in May and June compared with March. The notable increases for the lower deciles are a result of the introduction of social assistance for people of working age.
Although the wealthiest (tenth decile) loses the most in absolute terms, the eighth and ninth deciles lose slightly more in relative terms.
Figure 3: Percentage change in mean monthly household disposable income by decile since March in April, May, and June 2020 (includes pre-COVID-19 and COVID-19 policies)
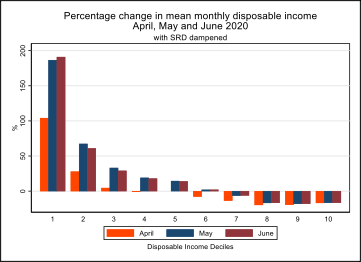
Note: simulated receipt of COVID-SRD benefit was dampened to match actual receipt (applicable to May and June only).
Source: authors’ analysis of output datasets from SAMOD V7.3-COVID.
Change in income poverty and inequality between March and June 2020
Table 2 shows how poverty rates changed across the four time points, using Statistics South Africa’s three poverty lines.
For each of the three poverty lines, the first row shows the poverty headcount ratio with all policies switched on (that is, taking into account both the set of policies that existed prior to the pandemic and those introduced to mitigate the impact of the lockdown), but with receipt of the COVID-SRD benefit dampened to match reported numbers of beneficiaries. Using all three poverty lines, poverty is higher in April and May when compared with March. Poverty reached its height in April when only the TERS had been introduced and no changes had been made to the benefit system. For example, using the food poverty line, poverty rose from 0.206 in March to 0.263 in April, meaning more than one-quarter of people in South Africa were below the food poverty line.
However, in June, poverty as measured by all three poverty lines fell to a level lower than March. The two policy differences between May and June were the switch from CSG top-up payments to a dedicated Caregiver-SRD, and an improved roll-out of the COVID-SRD from 4.4 million beneficiaries in May to 5.1 million in June.
Table 2: Poverty headcount ratio in March, April, May, and June 2020 under different assumptions
|
Poverty line |
Scenario |
March |
April |
May |
June |
|
FPL |
Existing policies (COVID-SRD dampened) |
0.206 |
0.263 |
0.209 |
0.188 |
|
Existing policies (COVID-SRD not dampened) |
N/A |
N/A |
0.164 |
0.177 |
|
|
All policies apart from COVID-19 policies |
N/A |
0.321 |
0.321 |
0.321 |
|
|
LBPL |
Existing policies (COVID-SRD dampened) |
0.326 |
0.379 |
0.343 |
0.307 |
|
Existing policies (COVID-SRD not dampened) |
N/A |
N/A |
0.276 |
0.291 |
|
|
All policies apart from COVID-19 policies |
N/A |
0.452 |
0.452 |
0.452 |
|
|
UBPL |
Existing policies (COVID-SRD dampened) |
0.482 |
0.525 |
0.527 |
0.475 |
|
Existing policies (COVID-SRD not dampened) |
N/A |
N/A |
0.461 |
0.468 |
|
|
All policies apart from COVID-19 policies |
N/A |
0.593 |
0.593 |
0.593 |
Note: FPL, food poverty line (R561 in April 2019 rands); LBPL, lower-bound poverty line (R810 in April 2019 rands); UBPL, upper-bound poverty line (R1,227 in April 2019 rands). Simulated receipt of COVID-SRD benefit was dampened to match actual receipt (applicable to May and June only). The poverty lines were inflated from April 2019 rands to March, April, May, and June 2020 rands using the consumer price index and then averaged.
Source: authors’ analysis of output datasets from SAMOD V7.3-COVID.
The role of the COVID-19 policies in curbing income poverty and inequality
In Table 2, for each of the poverty lines the poverty headcount ratio is shown for a hypothetical scenario in which the COVID-19 policies are switched off. Had there been no COVID-19 policies, poverty would have risen to 0.321 each month using the food poverty line (a 56% increase from the baseline in March), and to 0.452 using the lower-bound poverty line (a 37% increase), and to 0.593 using the upper-bound poverty line (a 23% increase). Had there been no COVID-19 policies, poverty would have risen to 0.321 each month using the food poverty line (a 56% increase from the baseline in March), and to 0.452 using the lower-bound poverty line (a 37% increase), and to 0.593 using the upper-bound poverty line (a 23% increase).
The COVID-19 policies played a particularly vital role for female-headed households, households containing children, and older people. Table 3 shows the poverty headcounts for these vulnerable groups. The same overall pattern is observed for the population as a whole: that is, poverty increased between March and April and then fell to levels lower than in March, though for these subgroups the fall to a level lower than in March occurs sooner (May) than for the population as a whole (June). For households containing one or more older people, poverty (as measured using the food poverty line) is almost obliterated. This was driven by the R250 increase to the Old Age Grant from May onwards.
The COVID-19 polices greatly reduced the extent of poverty that would otherwise have existed: without them, poverty in female-headed households would have risen to 0.351 (a 44% increase from the baseline in March), poverty in households containing one or more older people would have risen to 0.156 (a 62% increase from the baseline in March), and poverty in households containing one or more children would have risen to 0.339 (a 51% increase from the baseline in March).
Table 3: Poverty in March, April, May, and June 2020 for household subgroups, with and without the COVID-19 policies: food poverty line
|
Household subgroup |
Scenario |
March |
April |
May |
June |
|
Female-headed households |
Existing policies (COVID-SRD dampened) |
0.243 |
0.263 |
0.204 |
0.190 |
|
All policies apart from COVID-19 policies |
N/A |
0.351 |
0.351 |
0.351 |
|
|
Households with older people |
Existing policies (COVID-SRD dampened) |
0.096 |
0.121 |
0.008 |
0.009 |
|
All policies apart from COVID-19 policies |
N/A |
0.156 |
0.156 |
0.156 |
|
|
Households with children |
Existing policies (COVID-SRD dampened) |
0.225 |
0.279 |
0.193 |
0.179 |
|
All policies apart from COVID-19 policies |
N/A |
0.339 |
0.339 |
0.339 |
Note: simulated receipt of the COVID-SRD benefit was dampened to match actual receipt (applicable to May and June only). The household subgroups are not mutually exclusive. The food poverty line (R561 in April 2019 rands) was inflated from April 2019 rands to March, April, May, and June 2020 rands using the consumer price index and then averaged.
Source: authors’ analysis of output datasets from SAMOD V7.3-COVID.
Table 4 shows the Gini coefficient for each month. Inequality increased very slightly in April from March, but in May and June it fell to levels lower than in March. This was due to the reduced earnings in the top deciles, and increased incomes (mostly from the COVID-SRD and Caregiver-SRD) in the bottom deciles. In the absence of any COVID-19 policies, inequality would have increased to 0.676.
As the COVID-19 benefit changes started only in May, it is possible to attribute the reduction of inequality in April from 0.676 (in the hypothetical situation of no COVID-19 policies) to 0.648 wholly to the TERS income received by furloughed workers. Similarly, as TERS is applied in a constant way in April, May, and June, the further reductions in inequality in May and June can be attributed to the COVID-19 benefits.
Table 4: Income inequality in March, April, May, and June 2020 under different assumptions
|
Scenario |
Gini coefficient |
|||
|
|
March |
April |
May |
June |
|
Existing policies (COVID-SRD dampened) |
0.644 |
0.648 |
0.631 |
0.613 |
|
Existing policies (COVID-SRD not dampened) |
N/A |
N/A |
0.600 |
0.603 |
|
All policies apart from COVID-19 policies |
N/A |
0.676 |
0.676 |
0.676 |
Note: simulated receipt of COVID-SRD benefit was dampened to match actual receipt (applicable to May and June only).
Source: authors’ analysis of output datasets from SAMOD V7.3-COVID.
The COVID-19 policies had important redistributional effects. Mean disposable income increased for the lowest five deciles, remained largely unchanged for decile 6, and fell for deciles 7-10. However, although the percentage increases in mean disposable income are highest in the lowest deciles, the actual increases in rand amounts are low.
Significantly, only 13% of households in the first (poorest) decile had earnings prior to the pandemic in March 2020, and this fell to under 9% of households in April 2020. The mean earnings of those in the first decile are very low at both time points, which explains why the percentage change in disposable income is so great for the first decile between March and June: a COVID-SRD benefit of R350 per month is more or less equivalent to the mean monthly earnings of this decile.
In summary, the COVID-19 policies not only served to mitigate the impact of the pandemic and lockdown to a great extent, but also represent a long-overdue change in policy approach by providing social assistance to low-income adults of working age.
Conclusion and policy implications
Our study examined the impacts of the coronavirus pandemic on household incomes, poverty, and inequality in South Africa during the first wave of infections in April–June 2020.
We found that while the lockdown-induced decline in earnings would have caused a 25% drop in disposable income on average, the overall drop in disposable income in June was much smaller at 11%. The main contributors to the protection were TERS, and the package of augmented and new benefits introduced, including the COVID-19-SRD and the Caregiver-SRD. Overall, the drop in disposable incomes was highest in absolute terms among higher-income households; conversely, mean disposable incomes increased for the poorest income deciles, although only by a small rand amount.
We estimate that poverty increased in April when compared with the pre-crisis levels but it dropped in May and June. This is because of the COVID-19 policies, which for the first time brought in social benefits for non-disabled adults not eligible for unemployment insurance. Of all the grants in the package, only the COVID-SRD required substantial new implementation systems to be put in place. Poverty reduction would have been greater if all those eligible for COVID-SRD had benefited from it. Overall, the South African tax–benefit system provided considerable support for households during the first wave of the pandemic, even in an international comparison.
One of the main lessons of our analysis is the need to develop the South African social protection system further for the post-COVID world. The success of especially the COVID-19 benefit changes in poverty reduction underscores the need to have similar transfers in place in more normal times. That said, the current system was implemented as an emergency response: for example, the COVID-SRD was put in place in great haste to fill a gap in emergency funding, and its application procedures have not been easy for potential beneficiaries. They could be simplified within a design framework that splices this grant into an integrated system of grants. Similarly, the means test for receiving SRD is exceptionally stringent (requiring applicants to have zero income) and it would need to be reconsidered and harmonized with those being applied to the other social grants. Introducing new benefits is costly, of course, but financing options exist.
We have found there is much to be learned through the careful evaluation of the effectiveness of policies in guiding the country through the COVID pandemic, not only for this period, but for the overall goal of reducing both poverty and income inequality.
References
Casale, D., and D. Posel (2020). ‘Gender and the Early Effects of the COVID-19 Crisis in the Paid and Unpaid Economies in South Africa’. NIDS-CRAM Report. Cape Town, Stellenbosch, and Johannesburg: University of Cape Town, University of Stellenbosch, and University of the Witwatersrand. Available at: https://cramsurvey.org/wp-content/uploads/2020/07/Casale-Gender-the-early-effects-of-the-COVID-19-crisis-in-the-paid-unpaid-economies-in-South-Africa.pdf (accessed 8 April 2021).
Department of Employment and Labour (2020). ‘Unemployment and Labour on UIF Coronavirus COVID-19 TERS Payments’. Media Statement, 27 October. Available at: www.gov.za/speeches/unemployment-and-labour-uif-coronavirus-covid-19-payment-funds-exceed-r51-billion-27-oct#(accessed 8 April 2021).
Ingle, K., T. Brophy, and R.C. Daniels (2020). National Income Dynamics Study: Coronavirus Rapid Mobile Survey (NIDS-CRAM) Panel User Manual. Version 2. Cape Town: Southern Africa Labour and Development Research Unit.
Jain, R., J. Budlender, R. Zizzamia, and I. Bassier (2020). ‘The Labour Market and Poverty Impacts of COVID-19 in South Africa’. NIDS-CRAM Paper. Cape Town, Stellenbosch, and Johannesburg: University of Cape Town, University of Stellenbosch, and University of the Witwatersrand. Available at: https://cramsurvey.org/wp-content/uploads/2020/07/Jain-The-labour-market-and-poverty-impacts.pdf (accessed 8 April 2021).
Ranchhod, V., and R. Daniels (2020). ‘Labour Market Dynamics in South Africa in the Time of COVID-19: Evidence from Wave 1 of the NIDS-CRAM Survey’. NIDS-CRAM Paper. Cape Town, Stellenbosch, and Johannesburg: University of Cape Town, University of Stellenbosch, and University of the Witwatersrand. Available at: https://cramsurvey.org/wp-content/uploads/2020/07/Ranchhod-Labour-market-dynamics-in-the-time-of-COVID-19..pdf (accessed 8 April 2021).
Republic of South Africa (2020). Government Gazette Vol. 657, 26 March. Available at: www.gpwonline.co.za/gazettes/gazettes/43161_26-3_labour.pdf (accessed 8 April 2021).
Rogan, M., and C. Skinner (2020). ‘The Covid-19 Crisis and the South African Informal Economy: “Locked Out” of Livelihoods and Employment.’ NIDS-CRAM Paper. Cape Town, Stellenbosch, and Johannesburg: University of Cape Town, University of Stellenbosch, and University of the Witwatersrand. Available at: https://cramsurvey.org/wp-content/uploads/2020/07/Rogan-Covid-crisis-and-the-South-African-informal-economy.pdf (accessed 8 April 2021).
SALDRU (Southern Africa Labour and Development Research Unit) (2017). National Income Dynamics Study: Wave 5 [dataset]. Version 1.0.0. Cape Town: SALDRU. https://doi.org/10.25828/fw3h-v708
Statistics South Africa (2020). ‘29 September Quarterly Labour Force Survey (QLFS) – Q2: 2020’. Press Statement. Available at www.statssa.gov.za/?p=13652 (accessed 8 April 2021).
Wright, G., M. Noble, H. Barnes, D. McLennan, and M. Mpike (2016). ‘SAMOD, a South African Tax–Benefit Microsimulation Model: Recent Developments’. WIDER Working Paper 2016/115. Helsinki: UNU-WIDER. https://doi.org/10.35188/UNU-WIDER/2016/159-8
[1] See https://cramsurvey.org.
[2] Analysis of the distributional effects of COVID-19 and state-led remedial measures in South Africa, WIDER WP 2021/68
[3] Jain et al, 2020
[4] STATSSA, 2020
[5] Casale and Posel, 2020
[6] Ranchhod and Daniels, 2020
[7] Rogan and Skinner, 2020
[8] Jain et al, 2020
[9] Republic of SA, 2020
[10]Although most of the main tax and benefit policies that affect people’s incomes at the individual level are simulated in SAMOD V7.3-COVID, certain policies are not: value-added tax, grant in aid, the War Veterans Grant, and the usual UIF (i.e., non-TERS) payments. The only COVID-19 policy response that is not simulated is the introduction of tax payment deferrals.
[11] Disposable income refers to incomes after the deduction of simulated personal income tax payments and UIF contributions and having added all relevant simulated benefits.
[12] That is, those employed with no drop in earnings; employed with decreased earnings; furloughed; and not employed.
Download article
Post a commentary
This comment facility is intended for considered commentaries to stimulate substantive debate. Comments may be screened by an editor before they appear online. To comment one must be registered and logged in.
This comment facility is intended for considered commentaries to stimulate substantive debate. Comments may be screened by an editor before they appear online. Please view "Submitting a commentary" for more information.