Is the middle class becoming better off? Two perspectives
Introduction
Any discussion of changes in the income status of the middle class in South Africa depends on how the term middle class is defined. In a previous article on Econ3x3 (29 April 2013), I discussed how the common practice of defining the middle class as ‘the relatively affluent’ is inconsistent with a focus on those in the actual middle of the distribution of income. Widespread poverty and income inequality in South Africa imply that households which are in the middle in terms of their income status are still a long way off from what is deemed a middle-class standard of living. In fact, those in the middle still are quite poor.
In this article, I track the changes that have taken place in these two different ‘middle class’ groups since 1993 and ask: have they been becoming better off? The answer to this question provides a novel insight into changes in the income landscape in the country. I use data from the Project for Statistics and Living Standards 1993, the Income and Expenditure Survey 2000 and the National Income Dynamics Study 2008[1] (three nationally representative household income surveys) to tell this story.
Perspective 1: The affluent middle class and the black middle class
Media discussions of the ‘middle class’ commonly refer to households that have achieved a relatively affluent standard of living and that have a significant measure of buying power. As before, I define this ‘affluent middle class’ as people who receive income between R1,400 and R10,000 per capita per month in constant 2008 prices (measured in after-tax earnings). This would translate into a total household income of R5,600 to R40,000 per month for a family of four. The upper boundary of R10,000 per capita excludes less than 3% of the population and is not overly restrictive.
Did the affluent middle group grow significantly in size over the first fifteen years of South Africa’s new democracy? Table 1 shows the numbers of individuals in the different income classes as well as the share (%) of a particular class in total income for three different years. Since everything is measured in 2008 money terms, there is no distortion due to inflation.
Table 1: Class size (millions of individuals) and class share (%) of total population
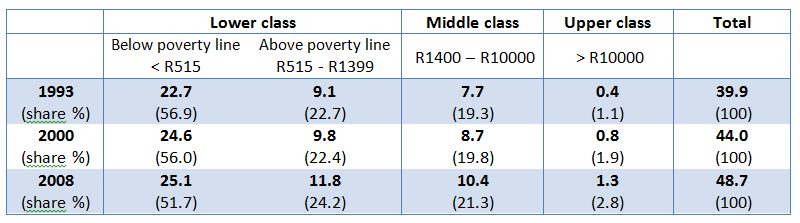
Source: PSLSD 1993, IES/LFS 2000, NIDS 2008
The relative growth in the size of the classes is pertinent. As shown in table 1, the affluent middle class grew in size by an additional 2.7 million people, from 7.7 million in 1993 to 10.4 million in 2008. However, this was only slightly ahead of population growth; hence, the population share of the affluent middle class increased only from 19% to 21% of the total population.[2] In contrast, the number of people in the upper class more than trebled in the same period and its share of the population more than doubled to 2.8%. In the lower class(es) the number of people also grew; importantly, the number of people in the lowest income class grew mostly slowly – thus its share of the total population declined.
A second aspect to be considered is the share of total income received by the middle class relative to that of other classes. Figure 1 shows the shares in total income of each class for each of the three years. The dominating result is that the income share of the upper class (which comprises just 2.8% of the population) grew to 32% of total income in 2008. Despite the increase in the number of people in the middle class, this class’s share of the country’s income declined from 56% in 1993 to 47% in 2007, compared to the increase from 17% to 32% for the upper class. The middle class and lower classes together actually lost ground in terms of their combined income share, which decreased from 83% to 68%.
This pattern corresponds with the research on income inequality in South Africa, which consistently reports that income inequality has increased since 1994. Figure 1 illustrates how income has accumulated in the hands of those at the very top of the income ladder – while the middle and lower classes have lost ground.
Figure 1: Income shares by class
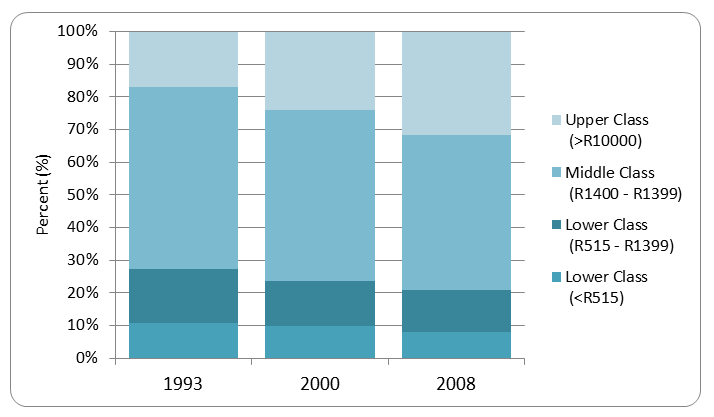
Source: PSLSD 1993, IES/LFS 2000, NIDS 2008
Modest growth in the size of the middle class may seem surprising in the light of the ubiquitous discussion of the ‘emerging black middle class’ in the media. How does one reconcile the noted slow growth of the South African middle class with the apparently strong increase in the size of the black middle class?
Three factors help to answer this question. Firstly, while I have distinctly separated the growth of the middle class from that of the upper class, many often-quoted studies summarily bundle the middle and upper classes together. Secondly, while the growth of the middle class has been slow in terms of the population share, in terms of absolute numbers of people the middle grew by 2.7 million, as noted above.
The third, and most important, factor is that a very different picture emerges when the racial composition of the affluent middle class is taken into consideration. The middle column of table 2 shows that the number of middle-class Africans more than doubled between 1993 and 2008, whereas the number of whites in the middle class actually shrunk by nearly a third (and in the upper class, the number of Africans grew from 19,000 to 257,000 in 15 years) – hence the story of the strong growth of the black middle (and upper) class.
Table 2: Race and class size (in thousands of individuals)
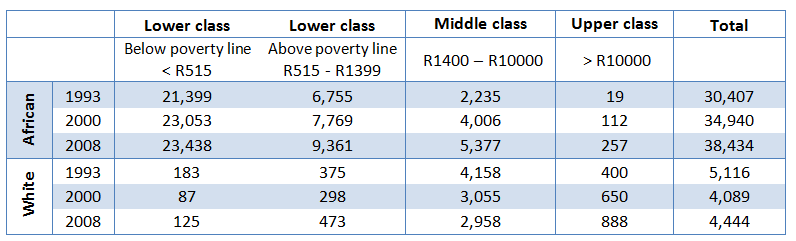
Source: PSLSD 1993, IES/LFS 2000, NIDS 2008
As shown in figure 2 below, the net result was a significant shift in the racial composition of the middle class: from a white majority in 1993 to an African majority by the end of the period. Falling numbers of middle-class whites are partly a function of the shrinking white population, also driven by high levels of white emigration particularly between 1993 and 2000. However, a small but notable number of whites have also moved into the upper class.
Figure 2: Racial composition of the affluent middle class
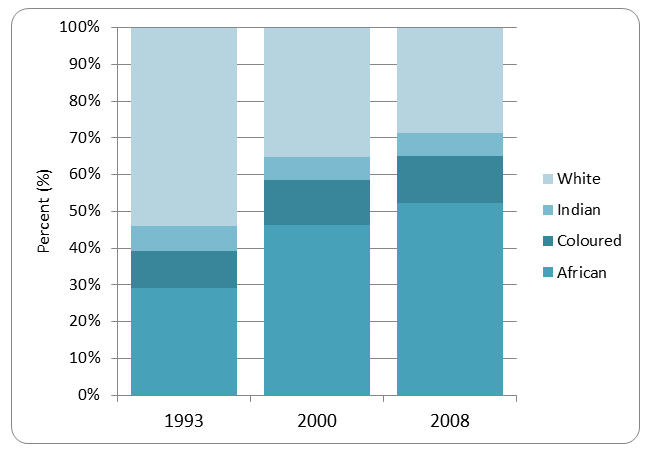
Source: PSLSD 1993, IES/LFS 2000, NIDS 2008
The central message here is that the affluent middle class shows real racial transformation over the first 15 years of democracy, and that these changes are driven by the rising numbers of middle-class Africans, coupled with falling numbers of middle-class whites. This is hard evidence of a fast-growing black middle class – but, importantly, it has occurred amidst very modest growth of the middle class as a whole. (This has been accompanied by a dramatic growth in the concentration of income and the number of Africans in the upper class.)
Perspective 2: The actual middle group and depressed growth
Switching attention to the actual middle of the distribution of income, we find households that may be in the actual middle of the spread of income – but are on the periphery in terms of their income growth. As before, the middle-income group is defined as households that fall within 50% to 150% of the median per capita household income – i.e. the households clustered around the median.
In 1993, the monthly median income per capita was only R690 (this amounted to R2,760 for a household of four persons). The corresponding income band (from 50% to 150% of the median) would equate to just R350 to R1,040 per capita per month (or R1,400 to R4,160 for a household of four). Thus, in 1993 the middle income group was actually quite poor. From this point the median income increased very slowly, rising to R750 in 2000 and to just R760 by 2008 (all in 2008 money terms). This implies an average growth rate in real income of only about half a percent per annum over the fifteen year period. That is very slow income growth indeed (and from a very low base). The middle group has remained quite poor.
Figure 3 depicts the so-called growth incidence curve (GIC) for 1993 to 2008. The GIC visually indicates the different average growth rates in real income for the poorest to the richest households (ranked from left to right) – i.e. it shows the different growth rates in real income experienced by households at each point in the spread of incomes. Thus, it shows how the overall growth in GDP was distributed across the income spectrum.
Figure 3: Who benefits from growth? Growth incidence curve 1993-2008
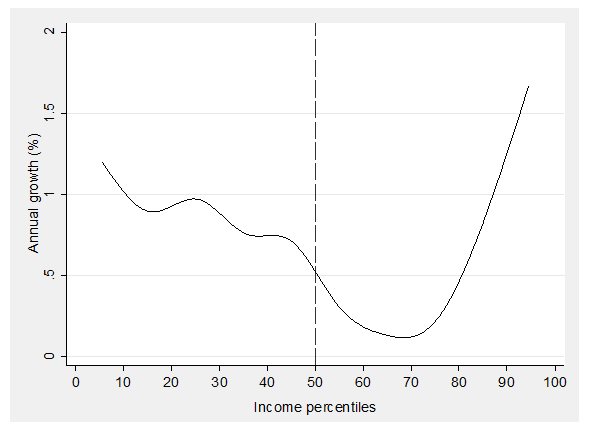
Source: PSLSD 1993, NIDS 2008
What is striking in South Africa is the U-shape of the curve – meaning that there is a polarised pattern of growth. For example, households in the lowest income groups (say at the 10% point) experienced an annual growth in real income of approximately 1%, while those in the highest income groups (say at 90%), experienced a growth in real income of approximately 1.5 per year. In contrast, those roughly in the middle had the lowest income growth by far. Many households in the middle (notably those just above the 50% point) experienced income growth rates around, or below, 0.5% per annum.
The observed U-shaped pattern is not only due to uneven economic growth. Incomes of households in the bottom section of the distribution were boosted by a massive increase in income from social grants after 2001, whereas those at the top experienced growth in market-based earnings. The middle group also benefited from growing income from government grants, but in their case these gains were largely offset by a fall in wage earnings. This group was not able to make much progress in terms of their own economic capacity and earnings growth. Their income was propped up by social grant income, in the absence of which one would have seen a marked deterioration in the socio-economic status of the middle group.
Conclusion
Taken together, these two perspectives on the middle class shed new light on the type of income growth achieved in the first fifteen years of democracy. The important points for policy are (a) that South Africa has experienced positive transformation in the racial composition of the middle (and upper) class; however (b) this transformation has come hand-in-hand with a marked concentration of income at the very top whilst (c) millions of households in the actual middle of the distribution of income experienced very slow income growth (and a fall in labour-market earnings).
Such a lack of absorption in economic activity and absence of income growth for the ‘average’ household over such a long period is reason for much concern. Rising political unrest and social instability in South Africa may be a symptom of such slow earnings and income progress in the middle group (which constitutes more than 30% of households). South Africa’s economic development path needs to become more inclusive – to actually involve these households in growing economic activity and thus earnings – if we are to succeed in moving a struggling middle away from the periphery of income growth.
* * *
[1] The National Income Dynamics Study provides a later wave of data for 2010/2011, but there was a high rate of sample attrition for individuals at the top of the income distribution, making it less useful for this study.
[2] If the number of middle class households are counted, as opposed to the number of middle class individuals, the proportional size of the middle class actually declined from 31% of households in the population to just 30% of households. This highlights the fragility of the proportional increase in the middle class.
Download article
Post a commentary
This comment facility is intended for considered commentaries to stimulate substantive debate. Comments may be screened by an editor before they appear online. To comment one must be registered and logged in.
This comment facility is intended for considered commentaries to stimulate substantive debate. Comments may be screened by an editor before they appear online. Please view "Submitting a commentary" for more information.
This is great - as it forces
This is great - as it forces a consideration of the structural challenges that still exist. But when can we expect an update from the 2008 numbers? The bifurcation of the society and the difficulty that there seems to be in accepting that this bifurcation is having political consequences as well as policy imperatives suggests that an update - if not to 2015 then at least into the Zuma presidential term - would be critical.