Part 3: Fiscal Dimensions of South Africa's Crisis
The debt drag
An ambitious consolidation
Shortly before the coronavirus pandemic hit South Africa’s shores, the Minister of Finance tabled a budget that planned for deep and sustained reductions in government expenditure. The emphasis on the need to contain government consumption was strengthened in subsequent budget statements. To achieve this, government is planning a four-year nominal freeze in remuneration (2019–2023) and large cuts to goods and services budgets.
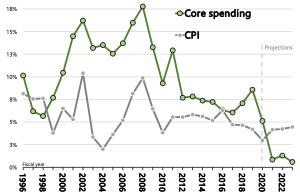
National Treasury projects government consumption will contract in real terms for the next three years. This would be the largest contraction in government spending since the transition to democracy, far larger than the programme associated with GEAR. (See Figure 1). Spending on capital, goods, and services by provincial and national government has been under pressure for several years. Over the past decade, cost containment has led to a deterioration in the quality of expenditure and an erosion of the real value of health and education services. In the absence of explicit policy choices, the burden of adjustment was shifted onto front-line services in the form of falling headcounts, deteriorating infrastructure, and hidden deficits in the form of unpaid suppliers and maintenance backlogs. It is difficult to see how the current proposed adjustment will be achieved without even deeper consequences for public services.
Figure 1: Nominal growth in core spending and consumer inflation
|
Source: National Treasury (Budget Review 2021), SARB, IHSMarkit and author’s calculations Notes: I define core spending as main budget non-interest spending excluding self-financing items and payments for financial assets. |
The planned consolidation implies a 14% reduction of real spending per capita over a three-year period. Since it targets government consumption, the consolidation is focused strongly on core elements of public provision: the value of basic education, healthcare, social grants, and the criminal justice system will be substantially reduced.
Government intends to erode much of this value by forcing down the real incomes of nurses, doctors, police officers, magistrates, court officials, prison warders, and teachers, along with auxiliary and support workers in these sectors – public servants who account for 70% of the government wage bill. But it is highly unlikely that the proposed fiscal consolidation can be achieved without also reducing the number of personnel, particularly in basic education, the criminal justice system and the defence force.
Considering that the population they serve is increasing, the real value of these services will decline. And since no similar wage restraint has been negotiated with the private sector – which provides the same services to affluent South Africans through parallel systems – the incentives for the best qualified personnel to shift out of the public sector will intensify, eroding the human capital base of public services.
Given the importance of public spending for the majority, especially black and poor citizens[1], questions must be asked about the political feasibility of this path, which follows hard on the heels of the shock that Covid-19 dealt to consumption, employment and incomes in 2020. It bears repeating that the blow will not only be harsh, but debt stabilisation requires that it be sustained over the next five years. At the very least, it is likely to be resisted, and the ensuing negotiations could have unpredictable consequences. In my view, it is unlikely that government will muster the political energy to sustain such a large adjustment into and beyond the next general election.
Moreover, expenditure cuts of this magnitude would be detrimental to economic growth. A sustained contraction in government spending is only compatible with accelerated economic growth if private consumption, exports or investment offset the shock. Such an outcome cannot be ruled out – especially given the support from elevated commodity prices in the short term – but fiscal policy will continue to act as a headwind, slowing the pace of economic recovery over an extended period.
Debt level vs. debt path
Without a sustained acceleration of economic growth, it is difficult to see how the deficit will be closed or debt stabilised. The June 2020 budget sketched two debt scenarios, which are shown in Figure 2 against the backdrop of the pattern since 1960. Prior to the recent uptick in commodity prices, several reviews of the data questioned whether the proposed cuts will be deep enough to stabilise debt. Burger reported that:
Treasury appears to have underestimated the size of the primary surplus the government will have to run to keep it to the active scenario path […] [I]t is unlikely that the debt-to-GDP ratio can be stabilised at any level below 100%, as doing so would require changes in the primary balance much greater (and much more painful) than is typically seen even in IMF adjustment programmes.[2]
He also warns it may dampen economic growth “merely by virtue of the fact that it would be a drag on aggregate demand. This, in turn, might render the policy self-defeating as it might dampen the denominator in the debt-to-GDP ratio more quickly than the numerator.[3]
Since this analysis however, there has been an unanticipated increase in commodity prices. This feeds directly into the incomes of corporations and affluent households, and therefore both widens inequality and provides a boon for tax revenue. Assuming government does not use this windfall to add to expenditure, this will lead to a faster reduction in the budget deficit than anticipated in the 2021 budget. By raising nominal growth, easing financial constraints and adding to tax revenue, elevated commodity prices may even provide the basis for apparent progress towards the stabilisation of debt. It is also the case that in the short run the impetus from elevated export prices will offset the negative headwinds imposed by the sharp fiscal consolidation, enabling economic growth to continue through 2021.
But, while predictions of commodity price developments are notoriously unreliable, there are good reasons to believe that the boom will not be permanent. If this is right it is likely that the underlying fiscal imbalances will return. It may even be that the trajectory of debt is held flat for a year before returning to its underlying upward trend.
Figure 2: Debt-to-GDP ratio and projections
|
Source: National Treasury, SARB, IHSMarkit and Author’s calculations |
Debt sustainability analysis of the kind employed by the IMF focuses on financial metrics and usually entails an assumption about a threshold for the debt-to-GDP ratio above which debt is judged unsustainable. This is reinforced by debates about whether there is a threshold beyond which the debt level impedes economic growth.[4]
But such thresholds are always arbitrary.[5] Debt sustainability analysis that rests on such a criterion are contingent on implicit judgements about the credibility of government, the quality of political institutions, and the future behaviour of public authorities and private investors in the face of debt distress. A more robust definition of sustainability is one that relies on the trajectory of the debt-to-GDP ratio rather than its ratio. Debt may be judged sustainable if the (financial) net worth of the public sector is improving or stable (at whatever level). Conversely, if the debt ratio is ever-increasing, then the financial net worth of the public sector is continuously deteriorating, and debt should be judged unsustainable.
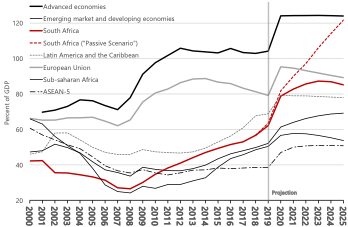
Prior to the global financial crisis of 2008, debt was stable at a high level in the “advanced economies”. After 2008, these economies took on significant additional debt to finance their fiscal response to the crisis and absorb private-sector banking liabilities onto government’s balance sheet. Between 2007 and 2012, the average debt-to-GDP ratio of this group increased by 44 percentage points and then stabilised after 2012, when the European Union and other advanced economies shifted towards “austerity” budgets. (see Figure 3) The Covid-19 crisis is expected to result once again in advanced economies adding around 20 percentage points of GDP on average to their stock of public debt. The IMF’s projections may look optimistic, but the point is that debt did stabilise after 2008 and is widely expected to stabilise again.
Figure 3: Debt-to-GDP ratios in country groups and South Africa (2000–2019)
|
Source: IMF World Economic Outlook (October 2020), IHSMarkit Notes: All projections are IMFs except South Africa “Passive Scenario” which is National Treasury’s |
If the debt-to-GDP ratio is compared with other countries in 2019, South Africa’s levels of public debt look relatively moderate. But if the trajectory of debt is more important than its level, South Africa’s position looks far weaker. In the past few years (even prior to the Covid-19 shock) debt accumulation has been accelerating. Whereas many countries engage in counter-cyclical debt accumulation, South Africa’s deficit path suggests an underlying and unresolved structural imbalance, which existed prior to – but has been aggravated by – the Covid-19 crisis.[6] A commodity windfall may very well obscure this picture in the short term, but as it subsides the underlying structural reality is likely to return.
The interest rate and growth of national income
There is a second reason why simple cross-country comparisons between the level of debt at a point in time are an insufficient guide to fiscal sustainability. The reason advanced economies have been comfortable taking on large chunks of new debt is that the interest rate on this new debt falls below the rate at which national income is growing. When r (the interest rate paid to service sovereign debt) is less than g (the growth rate of the economy), any level of debt and any budget deficit is more sustainable. If r stays below ginto the future, then debt can be rolled over as it loses value relative to income, making future tax increases unnecessary. Conversely, if the rate of interest rises above the rate of growth, then debt will increase of its own accord, even if there is no (primary) budget deficit.
Aizenman and Ito call this “the snowball effect”, showing that a positive snowball effect (i.e. r < g) reduces both the level and costs of servicing of debt over time. Conversely, if the snowball effect is negative (r > g),the costs of servicing debt rises and so does the potential for financial and macroeconomic crisis. Blanchard argues that r < g has often been the case in the USA, and infers that the “snowball effect” is likely to remain positive, justifying a higher level of debt.[7] Mauro and Zhou show that the same positive condition is widespread across developed and developing economies, including South Africa where r has been below gfor three quarters of the past 150 years.[8]
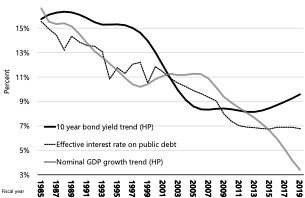
This might suggest grounds for optimism about debt sustainability in general, but Figure 4 gives reason for circumspection in South Africa’s case. For many years, the interest rate on South Africa’s sovereign debt has been declining along with the rates of safe assets around the world. The rising trend in the bond yield implies that r (effective interest rate) will rise. However, the staggering feature of Figure 4 is not the movement of interest rates, but the secular decline in the rate of nominal GDP growth. In South Africa, g is now far below r, and a negative snowball effect makes any deficit and any level of debt less sustainable.
In much of the world, sovereign interest rates are below economic growth, which has created space for additional debt. The IMF recommendations that developed economies take on further debt are rooted in the assumption that this position will be sustained.[9] In South Africa’s case, it is barely conceivable that debt can be stabilised unless the rate of economic growth rises. On current official forecasts, nominal GDP growth is expected to remain far below the 10-year bond yield over the next three years.
Once again, this view must be tempered in light of the recent commodity price increases. As we saw in Part 1, South Africa’s underlying macroeconomic fundamentals are closely tied to the price of its primary exports. The current windfall will raise nominal growth and ease financing conditions, helping moderate increased interest rates on public debt as capital flows in to take advantage of the short-term increase in corporate profitability. This windfall creates an opportunity for change but if it is squandered, as it was in the boom of the 2000s, it will be followed by a return to low nominal GDP growth, high interest rates, and a snowballing burden of debt.
Figure 4: Government’s interest on debt and the trend in nominal GDP growth
|
Source: SARB, IHSMarkit and author’s calculations. Note: The effective interest rate is interest payments on government debt divided by the average current and previous year’s GDP
|
South Africa’s high interest-rate burden
Reviving the pace of nominal growth is critical to stabilising debt. At the same time, it is worth asking why the interest rate South Africa pays on its sovereign debt is so high. In 2019, South Africa’s debt stock was equivalent to around 60% of GDP, close to that of Germany (at 58.9%). But South Africa allocated 4% of its domestic output to service its debt, whereas Germany paid only 0.6%. Italy had a debt-to-GDP ratio (at 133%) more than double that of South Africa but paid a lower share of its GDP to service this debt.
South Africa pays far higher interest rates on its public debt than most countries. This may be, in part, because inflation tends to be lower in advanced economies. But the higher interest paid by developing countries also reflects a sovereign risk premium. This occurs because creditors regard the liabilities issued by the USA or United Kingdom as safe assets but take the risk of sovereign default into account when advancing credit to the former colonies.
Fedderke (2020) investigates the factors shaping South Africa’s sovereign risk premium over the past 50 years. He finds the spread (or gap) between South Africa’s bond yields and those of the USA increases when South Africa’s economic growth slows. Other macroeconomic factors raise South Africa’s risk premium, including higher inflation, higher levels of public and private debt, and rand depreciation against the dollar.
Clearly the level of debt matters for the cost of debt servicing. However, it cannot be the whole story. If it were, Italy would pay more than South Africa to service its debt. On average, the advanced-economy members of the G20 have a debt load almost double that of their emerging counterparts but face a far lower interest burden.
Further explanations for the difference (in South Africa’s case) are highlighted in the observations that Fedderke makes about the long term trend:
‘While South African long-term yields declined significantly from 2000 onward (corresponding to the adoption of inflation targeting), this translated into a declining trend in spreads only until mid-2006, since when the trend has been upward. Startling is the observation that the rising spread became evident prior to the sub-prime crisis (though the latter arguably accelerated the increase), and that the spread in 2019 had reached levels last seen during the 1980 period of maximal political uncertainty and international financial isolation.’[10]
While falling spreads were correlated with the adoption of inflation targeting, a more plausible explanation is that the premium was determined by both policy innovation and “macroeconomic fundamentals”, and that the latter rested largely on the commodity price upswing and simultaneous the easing of global financing conditions. In this interpretation, the combination of accelerating, commodity-fuelled growth and global monetary easing drove down the value of – and cost of servicing – public debt. Even while government extended its permanent fiscal commitments, its position looked wholly sustainable. After 2012 global monetary conditions remained easy but global growth slowed, and South Africa’s growth ground to a virtual halt.
Political dynamics also left a mark on the risk premium. The timing of the upward shift between December 2007 and January 2008 coincides exactly with the ANC’s Polokwane conference. Subsequent fluctuations are strongly related to political events, such as the dismissal of Nhlanhla Nene as Minister of Finance in 2015.
The sovereign risk premium is now – as Fedderke points out – at levels last seen in the 1980s, which was a time of chronic economic stagnation combined with fundamental political uncertainty.
Today, the high interest rates that South Africa pays on its government debt reflect the twin forces of global economics and domestic politics. The balance between growth and interest rates are determined to a large degree by shifting global conditions. Capital markets fret that government might fail to honour its obligations, or fear what will follow the demise of 1994’s increasingly strained political settlement. A basket of fiscal obligations that might once have appeared sustainable can become the cause of national bankruptcy.
An intolerable burden of rent on debt
If debt continues to rise and interest rates do not abate, South Africa faces a significant increase in the burden of debt on public finances and the economy more generally. This burden is the flow of real resources needed to sustain interest payments to bond holders at the expense of taxpayers and the beneficiaries of public spending. It is effectively a rent extracted from current economic activity.
How large will this burden be? Debt service costs fell sharply during the 2000s, helping to create the fiscal space for expanded commitments to social policy. But by last year, 15c of every rand collected in revenue was allocated to bond holders. In the active scenario, National Treasury projects that debt costs will absorb 22% of revenue by 2022. If the current trajectory does not change, this will increase to a third of revenue before the decade is out. In term of national income, South Africa allocates around 4% of the output it produces to servicing public debt. This will grow rapidly, perhaps reaching towards 10% by the end of the decade.
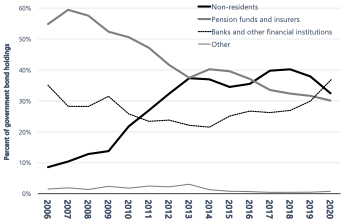
Figure 5: Holdings of South African government bonds
|
Source: National Treasury (2020) |
Since 2006, bonds held by non-residents have increased dramatically, as part of a global flow of capital towards emerging markets (see Figure 5). When non-residents own government bonds, the associated interest payments are an outflow that must be deducted from national income. There is evidence that this becomes a drag on economic growth.[11] However, since 2018, foreign ownership of government bonds has fallen, a process sharply accelerated by Covid-19.
As South Africa’s debt crisis intensifies, it can be expected that foreign exit from the domestic bond market will continue, and an increasing share of government bonds will be held domestically. While interest payments to foreigners subtract from national income, interest payments on domestically held debt result in income transfers between South Africans.
In an extremely unequal society such as South Africa, the concern should be not only the flow of income overseas, but also the impact these payments have on the distribution of income at home.
Interest payments can be thought of as a transfer of income from taxpayers to bond holders. Most bonds are held by financial intermediaries, such as pension funds and banks, and so the income does not go directly to households. However, the assets held in these institutions do ultimately benefit (affluent) households through their ownership of banks and their interest in pension funds.
Until now, spending has been strongly concentrated on the poorest 50% of the population. Taxation is concentrated on the most affluent 10% of households, which contribute 72% of the taxes covered in one study[12] (which excluded consideration of taxes on corporate income and wealth). (see Figure 6)
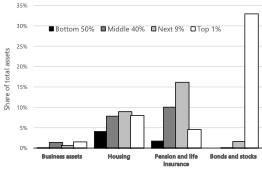
In terms of asset ownership, two-thirds of South African wealth is held in the form of stocks, bonds, pension funds and life-insurance assets. Ownership of stocks and bonds – through collective investment schemes and other vehicles – is strongly concentrated at the top, with the wealthiest 1% of South Africans owning 95.2% of these assets. The wealthiest 10% of South Africans own 64% of pension fund and life insurance assets.[13] (See Panel (b), figure 6)
This evidence suggests that debt accumulation will erode the progressive character of South Africa’s fiscal structure by diverting an increasing share of tax revenue to domestic bond holders. Rising debt-service cost also crowds out expenditure, which is well targeted at less affluent South Africans. Government will face an increasingly stark choice between forcing down expenditure on the poorest, continuously increasing taxation or failing to honour its debt-service obligations.
Figure 6: Concentration of income, taxes and spending and wealth ownership by asset class
|
(a) Concentration of market income, taxation and government spending by household income groups |
|
|
(b) Concentration of wealth by assets class and wealth group
|
|
|
Source (a): Inchauste et al. (2015) and author’s calculations Source (b): Chatterjee et al (2020) and author's calculations |
|
Conclusion
In this article, we have focused on the breadth and depth of South Africa’s fiscal crisis, including the sustainability – or not – of its debt level. We have also argued that the trajectory of debt, and its relation to the rate of growth, is more important than the levels itself.
Failure to find policy solutions to contain rising debt-service costs may have negative impacts on the progressive nature of the tax structure, which is currently strongly focused on public services for the poor.
In the next and final article in this series, I will look at possible policy solutions and assess their strengths and shortcomings.
References
Aizenman, Joshua, and Hiro Ito, 2020. ‘Post Covid-19 Exit Strategies and Emerging Markets Economic Challenges’. NBER Working Paper Series Working Paper 27966.
Blanchard, Olivier. 2019. ‘Public Debt and Low Interest Rates’. American Economic Review 109(4):1197–122
Burger, Professor Philippe. 2020. ‘South Africa’s Debt: Has the Budget Overpromised?’ CDE Viewpoints 2020(10).
Chatterjee, Aroop, Leo Czajka, and Amory Gethin, 2020. ‘Measuring Wealth Inequality in South Africa: An Agenda’. WID Working Paper 2020(6)
Fedderke, Johannes, 2020. ‘The South African - United States Sovereign Bond Spread and Its Association with Macroeconomic Fundamentals’. South African Reserve Bank Working Paper Series WP/20/09:36.
Herndon, Thomas, Michael Ash, and Robert Pollin, 2014. ‘Does High Public Debt Consistently Stifle Economic Growth? A Critique of Reinhart and Rogoff’. Cambridge Journal of Economics 38(2):257–79. doi: 10.1093/cje/bet075.
IMF, 2020. Fiscal Monitor: Policies for the Recovery. International Monetary Fund, Fiscal Affairs Department.
Inchauste, Gabriela, Nora Lustig, Mashekwa Maboshe, Catriona Purfield, and Ingrid Woolard, 2015. The Distributional Impact of Fiscal Policy in South Africa. World Bank Group.
Oosthuizen, Morné. 2019. ‘Inequality and the Generational Economy Race-Disaggregated National Transfer Accounts for South Africa’. WIDER Working Paper (2019/24):54.
Reinhart, Carmen M., and Kenneth S. Rogoff. 2010. ‘Growth in a Time of Debt’. American Economic Review 100(2):573–78. doi: 10.1257/aer.100.2.573.
Wyplosz, Charles,2011. ‘Debt Sustainability Assessment: Mission Impossible’. Review of Economics and Institutions 2(3):37. doi: 10.5202/rei.v2i3.42.
[1] Oosthuizen, 2019
[2] Burger 2020
[3] Ibid
[4] See Reinhart and Rogoff, 2010; Herndon et al, 2014
[5] Wyplosz, 2011
[6] South Africa is certainly not alone in this position. Sovereign debt distress in the wake of Covid-19 is anticipated to reach levels not seen since the crisis of the 1980s (Bolton et al., 2020). The IMF expects 54 low-income countries to face debt distress (IMF, 2020).
[7] Blanchard, O, 2019
[8] Mauro and Zho, 2020
[9] IMF, 2020.
[10] Fedderke, 2020
[11] Aizenman and Ito, 2020
[12] Inchauste et al, 2015
[13] Chatterjee et al, 2020
Download article
Post a commentary
This comment facility is intended for considered commentaries to stimulate substantive debate. Comments may be screened by an editor before they appear online. To comment one must be registered and logged in.
This comment facility is intended for considered commentaries to stimulate substantive debate. Comments may be screened by an editor before they appear online. Please view "Submitting a commentary" for more information.