What caused the increase in unemployment in the late 1990s? Were education policies partly responsible?
1. Introduction
In the late 1990s, the Department of Education (DoE) implemented two policies to reduce the number of over-age learners in the South African school system: schools were discouraged from enrolling over-age learners and, simultaneously, were restricted with regard to the number of times learners could repeat a grade. At about the same time a sudden, a large increase occurred in the number of people who wanted to work and hence in the number of unemployed. This invites the following question: to what extent might these policies, which attempted to reduce pupil-teacher ratios, have unintentionally contributed to the coincident increases in participation in labour force participation and in unemployment?[1]
2. The sudden increase in participation and unemployment
In 1997 the (broadly defined) labour force participation rate – which measures the percentage of people of working-age who are either working or unemployed – was 56%. In the following years the rate increased unexpectedly by 11.8 percentage points, reaching 67.8% by 2003 and remaining relatively stable thereafter. By 2003 there were 19.6 million people in the labour force – 3.4 million more than in 1997 (after an adjustment to allow for the effects of population growth).
The sudden increase in participation meant that the broad unemployment rate increased equally suddenly by 5.4 percentage points – from 36.4% to 41.8%. This occurred despite a modest increase in measured employment. This means that, of the 3.4 million additional labour force participants, 2.3 million wound up being unemployed (broadly defined), which is a huge increase by any measure.
The reasons for this increase are not yet well understood. A frequently-cited explanation is the increased participation of women in the labour force (Casale & Posel 2002).[2] And the ‘feminisation of the workforce’ argument does indeed explain part of the increase in overall participation rates, but it does not account for the sudden increase in the entry into the labour market of the youngest generations of both genders – a notable characteristic in the data in this period.
3. Restrictions on over-age learners and grade repetition: the history
In the past, many youths stayed at school long beyond the normal school-going age. In 1998, 60% of Grade 12 learners were older than the correct age for their grades (Guluza & Hoadley 1998, p.1). This kept class sizes and pupil-to-teacher ratios high and tied up scarce educational resources.
Shortly after 1994, the DoE discussed a strategy to reduce the number of over-age learners (RSA 1995). In the late 1990s, they phased in restrictions on over-age learners and limited the number of times a student could repeat a year. The intention was to achieve a more normal through-flow of learners through the school system and to reduce the number of over-aged learners, thereby also reducing pressure on educational resources. Schools were supposed to deny admission to learners who were more than two years older than the appropriate age for their grade. [3] At about the same time, the DoE ruled that any learner could only be compelled to repeat a grade once during any of the four education phases (OECD 2009).
These directives were gradually adopted in at least some provinces.[4] Although it was envisioned that ‘older learners would be referred to adult education centres’ (DoE 2000, p.24), the scarcity of such institutions and high fees made this unrealistic (Guluza & Hoadley 1998).
4. The impact of the new schooling policies: the evidence
4.1 The change in total school enrolment
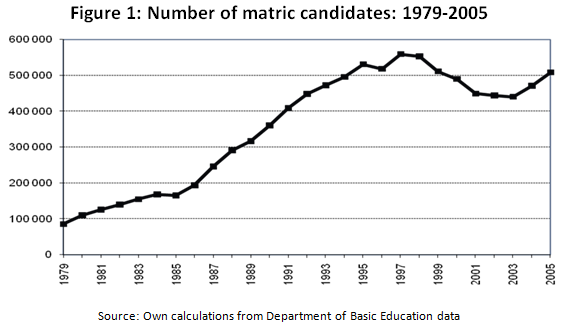
DoE administrative data show a sudden decline in total primary and high school (i.e. grades 1 to 12) enrolment from 12.08 million to 11.66 million between 1998 and 2003 (Kraak 2008:12). This implies that about 425 000 fewer learners were enrolled at school in 2003 than in 1998. Estimates based on household surveys show an even larger decline in enrolment of 515 000 learners. Matric candidates decreased by 20% between 1998 and 2003 (see figure 1). These declines reversed a previous trend of gradually growing enrolment numbers.
In particular, the number of over-age learners (defined as those more than two years older than the correct grade age) decreased by 865 000 between 1999 and 2003. The new schooling policies were very successful in removing over-age learners from the school system.[5]
4.2 More specifics: the intended effects on enrolment and promotion rates
From household survey data we can estimate the enrolment and promotion rates in different school grades, years and age groups. The enrolment rate is defined as the share of the relevant group that is enrolled at school, and the promotion rate as the share of enrolled learners who are promoted to the next school year.
Figure 2 shows the estimated enrolment and promotion rates for grade 11 learners. These are typical of the pattern for other grades. Consider the left-hand diagram first. The red curve shows the rate of enrolment for learners of different ages prior to the implementation of the new policies. The rate of enrolment was very high for grade 11 students of 17, the correct age for their grade (indicated by the solid vertical line). For older learners, the rate gradually dropped off. After the implementation of the policies, enrolment rates (the blue line) remained very high for correct-aged learners, but dropped off much more than before for over-aged learners. For example, prior to 1997 approximately half of 23 year old learners who had completed 10 years of schooling continued at school; by 2003 that proportion dropped to less than a quarter (see the vertical dashed line). This is exactly what these policies aimed to achieve.
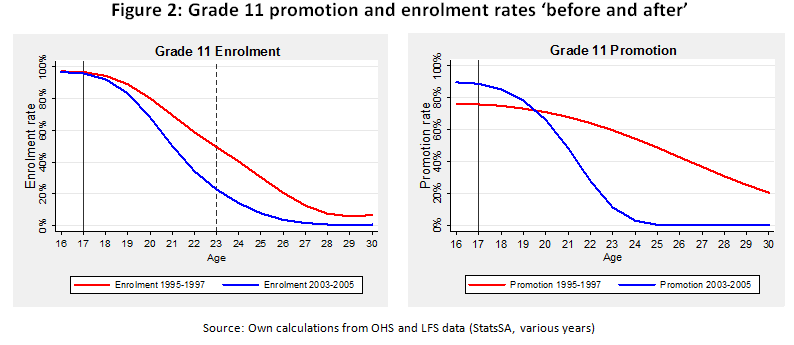
The right-hand diagram shows the pattern for the promotion rates. The red line indicates the promotion rates for 1995-1997 (before the change of policy). About 80% of grade 11 learners of the correct age successfully completed their school year and were promoted to grade 12. This share dropped off for older learners, who were probably not academically strong. After the implementation of the new education policies, the promotion rate for correct-aged learners actually increased, to almost 90% (the blue curve). This is consistent with a policy aiming to reduce the repetition of grades. But the drop-off in the promotion rate for over-aged learners was dramatically more than before – they were much less likely to be promoted.
The analysis of promotion and enrolment rates provides another way of estimating the combined effect of these two policies on total school enrolment. Our estimates show that, if promotion and enrolment had continued at their pre-1997 rates, by 2003 total school enrolment would have been 923 000 higher than what was observed. This implies that a huge number of young people were being released into the labour market.
4.3 The unintended effects on labour force participation and unemployment
We proceed to consider the effects of these policies on people’s participation in the labour force and on unemployment. Data from household surveys can be used to track the labour force participation rates of individuals in terms of the year of their birth. We use a technique that removes business-cycle fluctuations and typical life-cycle patterns from the data. We can then compare the ‘cleaned-up’ participation rates across races and genders. In this way we obtain a clearer picture of participation behaviour.
Figure 3 shows how the labour force participation rates differ for people born in different years. The dashed lines show the results for women (blue for black women, red for white women). The general pattern is that younger generations of women have become much more likely to want to work than their older counterparts: the participation rate is much higher for women born more recently. Although we see something similar for younger generations of men when compared with older men, for men the increase is slight. The rising participation trend of women is the so-called ‘feminisation of the work force’ that has been identified by researchers. However, it has occurred gradually over a long period and cannot really explain the sudden increase in labour force participation between 1997 and 2003.
It is important to notice the sudden increase in participation rates for black men and women born approximately between 1975 and 1982. Note the (encircled) sudden increase in the two blue lines after 1975, which remain at a higher level thereafter. Those born after 1982 were significantly more likely to want to work (especially at a young age) than those born before 1975.
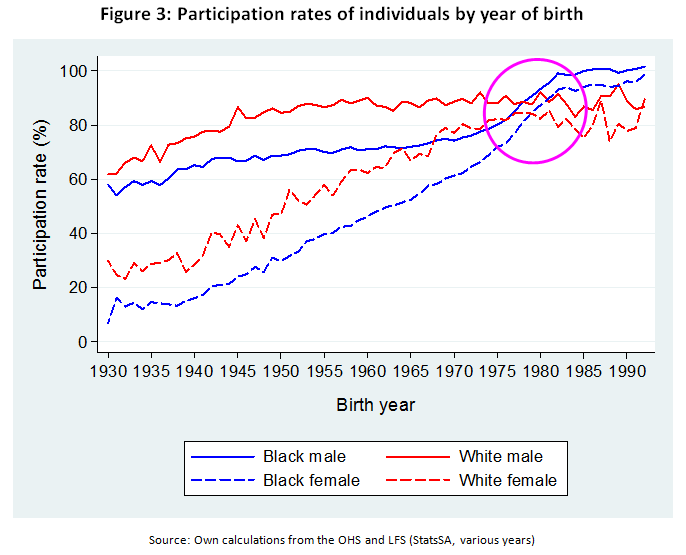
Something must have happened to cause such different behaviour – in terms of their desire to work – in individuals born between 1975 and 1982. And this is the point: members of this group were between 16 and 22 years old in 1998 and therefore would have been exactly the group affected by the new over-age and promotional restrictions. The timing and suddenness of their increased participation rates match the changes in school enrolment and grade promotion almost exactly.
In the 1990s, over-age learners were more likely to be black, male, live in a rural area, and reside in the Eastern Cape, Limpopo, Free State and Mpumalanga. These characteristics are also associated with a lower probability of finding work – which means that the decision to remain at school despite having to repeat a grade several times, may have made sense given the bleak prospects in the labour market. The new education policies ruled out this option. And it is unlikely that many of these individuals would have successfully found work having been pushed out of the school system. They are likely to have joined the ranks of the unemployed.
5. Conclusion
Our research suggests that regulations to restrict over-aged schooling and to increase promotion rates in the late 1990s led to a drop in total school enrolment of approximately 923 000 learners who where then pushed into the labour market, where most of them were unlikely to find work. Of the increase of 2.3 million, between 1997 and 2003, in the number of unemployed people, as many as 900 000 can probably be attributed to the unintended effects of these policies.
Prior to 1997, this large group of over-aged learners, being at school, were classified as ‘not economically active’ rather than as unemployed job-seekers. This made the unemployment problem – and youth unemployment in particular – seem less serious than actually was the case at the time. The unintended effect of the promotion policies and restriction on over-aged learners was to bring into the open a component of unemployment (among the youth) that had been hidden for a long time – and that needed to be addressed with appropriate policies.
In other words, before the changes in the education policy, measured unemployment was kept artificially low – by approximately 3 percentage points – due to schools’ carrying a mass of over-aged youth who should have been in the labour force rather than at school.
References
Burger, R.P., Van der Berg & Von Fintel, D. (2012). The unintended consequences of education policies on South African participation and unemployment. Working Paper 11/12. University of Stellenbosch.
Casale, D. & Posel, D. 2002. The continued feminisation of the labour force in South Africa: An analysis of recent data and trends. SA Journal of Economics 70(1).
Department of Education 1998. Age requirements for admission to an ordinary public government school. Government Gazette no. 2433.
Guluza, X. & Hoadley, U.K. 1998. Learner Progress and Achievement Study: Research report 2, Joint Education Trust. Braamfontein.
Kraak, A. 2008. The education-economy relationship in South Africa, 2001-2005. In: A. Kraak & K. Press, eds. Human Resources Development Review 2008. HSRC Press.
OECD 2009. Reviews of National Policies for Education: South Africa. Paris.
RSA 1995. Meeting the Commitment to Free and Compulsory General Education. Chapter 13, White Paper on Education and Training. Department of Education.
[1] See Burger et al (2012) for a fuller discussion, also of the more technical aspects.
[2] Casale and Posel (2002) ascribe the large increase in women’s labour force participation (particularly of black African women) to women’s obtaining higher levels of schooling, having lower marriage rates and being less likely to reside with an employed male. Other possible explanations for the increase in total participation are StatsSA’s changes in the method of sampling and their redesign of questionnaires to capture employment and labour force participation better. See Burger et al (2012) and the references cited there.
[3] In Age Requirements for Admission to an Ordinary Public School (DoE 1998), the DoE defined the appropriate age for admission to a certain grade as ‘the grade number plus 6’.
[4] As schooling is legally compulsory until the age of 15, the affected learners would have been older than 15, more than two years older than the correct age for their grades, and wanting to enrol in school after 1998.
[5] The fact that the latter number is significantly larger than the total enrolment decline of 515 000 (from the household surveys) implies that the number of normal-aged students has continued to grow over this period.
Download article
Post a commentary
This comment facility is intended for considered commentaries to stimulate substantive debate. Comments may be screened by an editor before they appear online. To comment one must be registered and logged in.
This comment facility is intended for considered commentaries to stimulate substantive debate. Comments may be screened by an editor before they appear online. Please view "Submitting a commentary" for more information.
There is another concerning
There is another troubling outcome to these policies of the Department of Education (whereby the number of times a learner could repeat a grade is restricted).
It is extremely critical that learners first master the basics of reading, writing and mathematical skills in the Foundation Phase (grade R - grade 3) before they are promoted to the next grade. Too many learners struggle to read properly, with comprehension and fluency.
To be proficient in reading a learner must, in short, be able to recognize and analyze letter sounds and words. Furthermore, a learner must be able to link and read words together as sentences with comprehension and fluency (Hill & Launder, 2010:241).
According to research, the natural developmental pattern of the learn-to-read process starts much earlier than grade 1. Literacy development starts at birth and develops through exposure to language at home, school and in the community through real-life experiences. The first words from a mother to her newborn through her caring for, nursing and nurturing of her child is the beginning of language and reading development. The self-made-up rhyming words, nursery rhymes, action rhymes, songs, narratives and stories that a mother shares with her child, already forms part of the foundation skills of emergent literacy. [Early literacy or emergent literacy refers to a period in a child’s life from birth until he/she can read and write conventionally. The concept of 'emergent literacy' is based on the view that a child’s development of listening, speaking, reading and writing are interconnected (Morrow et al., 2011: 69; Justice et al., 2003:320).]
If more attention could be given to the development of the reading process at the right time, we could be looking at a different picture in the economy and in education. However, if that is not achieved, premature promotion to the next grade is likely to occur in many cases (if the new policy is rigorously applied) - and many learners (and workers) will continue to struggle.
Bibliography
Greaney, K. & Arrow, A. 2012. Phonological-based assessment and teaching within a first year reading program in New Zealand. Australian Journal of Language and Literacy, 35 (1):9-32.
Hill, S. & Launder, N. 2010. Oral language and beginning to read. Australian Journal of Language & Literacy, 33 (3):240-254.
Justice, L. M., Chow, S., Capellini, C., Flanigan, K. & Colton, S. 2003. Emergent literacy intervention for vulnerable preschoolers: Relative effects of two approaches. American Journal of Speech-Language Pathology, 12:320–332.
Lonigan, C. J., Burgess, S. R. & Anthony, J. L. 2000. Development of emergent literacy and early reading skills in preschool children: Evidence from a latent-variable longitudinal study. Developmental Psychology, 36:596-613.
Neuman, S. B. & Dickinson, D. K. 2003. Emergent literacy: Development from prereaders to readers. In: G. J. Whitehurst., C. J. Lonigan (reds.). Handbook of Early Literacy Research.New York: The Guilford Press. 12-22.
Morrow, M. L., Tracey, D. H. & Del Nero, J. R. 2011. Best practices in early literacy preschool, kindergarten and first grade. In: L. M. Morrow & L. B. Gambrell (reds.). Best Practices in Literacy Instruction. New York: Guilford Press. 67-93.