The Covid-19 crisis has amplified spatial inequalities
Introduction: why geography matters
The geography of South Africa’s twin public-health and economic crises has been neglected to date, despite major contrasts in the vulnerability and resilience of different communities. Since South Africa is one of the most unequally developed countries in the world, one would expect Covid-19 to have uneven spatial impacts. The geography of the economy matters because some places – with more diverse industries and stronger institutions – are better resourced than others to withstand and recover from shocks. The geography of the population matters because the risks facing different communities vary greatly, given that they have different assets and capabilities to fall back on in times of disaster.
The analysis of and response to the pandemic has focused on the national and provincial levels, yet the coronavirus spreads locally through human contact and interaction. Large cities became the infection hotspots and experienced higher mortality rates than towns and rural areas. This reflected the relatively high population densities of cities and their strong connections to external regions and nations. However, assessing the impact of Covid-19 on the welfare of people living in townships, informal settlements and rural areas is vital because of the precarious nature of jobs and livelihoods in these communities. Many of these places also have inhospitable living environments as well as weaker social infrastructure and safety nets than suburban areas.
This article, based on a recent research report (Visagie & Turok 2020), analyses the impact of the Covid-19 crisis on different types of locality and region. This is important since government responses need to be targeted more carefully on the distinctive challenges and opportunities of different places. A uniform, nationwide approach that treats places equally will not narrow (or even maintain) the gaps between them, just as the blanket lockdown reflex had adverse unintended consequences.
The analysis presented here is novel because previous studies of the impact of the crisis have focused on the attributes of individuals (race, gender, education, occupation, earnings, etc.) and paid little attention to spatial considerations (compare Spaull 2020).
Method of analysis
Two methods are employed for analysing spatial patterns and trends. The first is concerned with the disparities between three different types of region: large cities (‘metros’), smaller cities and towns (‘cities/towns’), and the countryside (‘rural areas’). The rationale for this is that one would expect large cities – with their more diversified economies, larger firms and deeper reserves – to be better equipped to bounce back from the restrictions imposed by the hard lockdown.
The second focuses on the differences within cities between relatively rich and poor neighbourhoods. A four-fold classification, based upon residents’ own perceptions, is used to distinguish between suburbs, townships, shack dwellers (informal settlements and backyarders) and peri-urban areas (which include small-holdings, farms or tribal land on the urban fringe). The rationale for this classification is that one would expect the suburbs to be more resilient to the lockdown because residents tend to have more secure jobs, more savings and find it easier to work from home.
The article focuses on three crucial dimensions of the Covid-19 crisis: the impact on the labour market, household incomes and the incidence of hunger. These are obviously connected, with causation presumed to run from the labour market to household incomes and onto hunger. The logic is that changes in employment (job losses) are transmitted to households through a loss of earnings, which in turn affects whether people go hungry.
The severity of the economic shock has been ameliorated by social assistance from the government in the form of additional, Covid-related payments. A special Covid-19 Social Relief of Distress (SRD) grant worth R350 per month was introduced for the unemployed in June 2020. This occurred in addition to (a) top-ups to existing grants (for childcare givers, older persons, people with disabilities and war veterans) and (b) temporary relief for workers made unemployed (UIF payments).
The evidence comes from household survey data, gathered during waves 1 and 2 of the National Income Dynamics Study: Coronavirus Rapid Mobile Survey (NIDS-CRAM). The NIDS-CRAM survey was designed as a ‘barometer’ to assess the socio-economic impact of Covid-19 (Spaull et al 2020). It was based on a sample of adults who were previously surveyed in Wave 5 of the NIDS in 2017. They were re-interviewed in May/June 2020 (NIDS-CRAM wave 1) and again in July/August (NIDS-CRAM wave 2). Thus, the NIDS-CRAM surveys provide an additional two rounds of socio-economic data, for a subsample of these adults, to assess the impact of the Covid-related crisis and relief measures.
What the evidence shows
The first and most important finding is that the pandemic has magnified existing economic divides (i) between cities and rural areas, and (ii) between suburbs and townships/informal settlements within cities.
Employment and unemployment
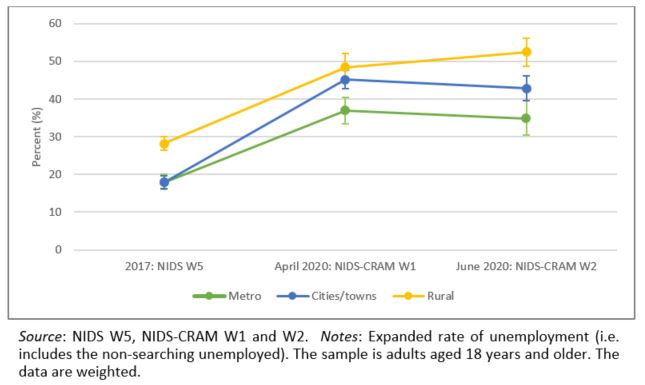
The metros proved more resilient than rural areas and cities/towns. They started out in February in a much stronger position with 57% of adults in paid employment, compared with 46% in smaller cities/towns and 42% in rural areas. All regions lost about a fifth of their jobs between February-April. However, between April-June metros and smaller cities/towns showed some signs of recovery, mainly through furloughed workers being brought back onto the payroll, while rural areas continued to lose jobs.
The net result was that rural unemployment in June was 52% compared with 43% in cities/towns and 35% in the metros (see figure 1).
Figure 1: Rate of unemployment 2017 to June 2020
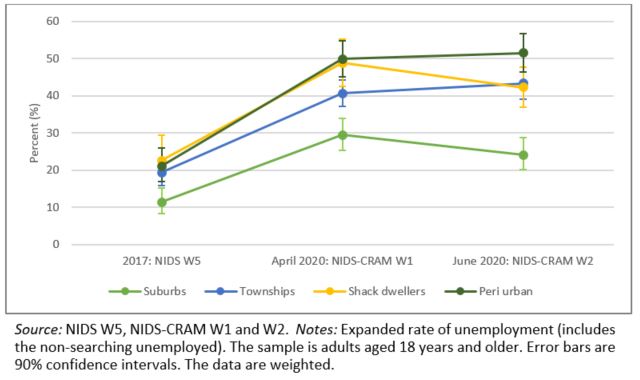
The suburbs coped with the lockdown better than townships and informal settlements. They were in a strong position in February with 58% of adults in paid employment, then lost one in seven of their jobs (14%) by April, compared with one in four in the townships (24%) and peri-urban areas (23%) and more than a third of jobs (36%) in shack areas! Shack dwellers were extremely vulnerable to government restrictions on informal enterprise during the hard lockdown. Overall, the economic crisis has hit poor urban communities much harder than the suburbs, resulting in a rate of unemployment of 42-43% in townships and informal settlements compared with 24% in the suburbs (figure 2).
Figure 2: Rate of unemployment 2017 to June 2020
Household incomes: benefiting from government grants
The second set of findings relates to the provision of social assistance from the state. Rural communities are generally much larger beneficiaries of existing government grants than the metros and smaller cities/towns. Nearly three out of five rural respondents (59%) lived in households receiving social grants in June 2020, compared with less than half in cities/towns (47%) and one in three in the metros (32%). This is because rural residents are far less likely to be in paid employment. Government grants clearly help to protect rural livelihoods and compensate these communities for their weak local economies and lack of jobs.
Similar points apply to the differences within cities: more than half of peri-urban respondents (54%) lived in households receiving social grants, compared with less than half of township residents (45%), two in five shack dwellers (40%) and one in four suburban residents (26%). The implication is that government grants help to offset unemployment and poverty in townships and informal settlements.
In terms of special relief from the crisis, one in three rural residents (33%) said that someone in their household had received the Covid-19 SRD grant, compared with one in four in cities/towns (24%) and one in five in the metros (21%). These differences are smaller than for other grants, suggesting that the Covid-19 grant is indeed benefiting people who did not qualify for government support before, such as unemployed men. Among urban residents, 29% of peri-urban residents said their households had received the Covid-19 SRD grant, compared with 27% in townships, 18% of shack dwellers and 16% in suburban areas.
The disproportionate reliance of some rural and urban areas on the new Covid-related grants and top-up payments poses a risk to living standards when the temporary relief is withdrawn. The premature withdrawal of these forms of social assistance before the economy has really recovered is bound to aggravate conditions these communities.
It is notable that the proportion of shack dwellers (i.e. those in informal settlements and backyards) that receives these and other grants is surprisingly low, considering their levels of poverty and distress. Further research is required to explain this.
Hunger
The third set of findings relate to the incidence of hunger. Hunger is a serious concern because its risks malnutrition, undermines human development and threatens social discontent. One measure is the proportion of respondents who said their household had run out of money to buy food. In April this was 44% in the metros, 48% in the cities/towns and 52% in the rural areas – very high everywhere. By June 2020, these proportions had fallen to 35% in the metros, 37% in the cities/towns and 40% in the rural areas.
Another measure is the proportion of respondents who said that someone in their household had gone hungry in the last seven days. In May/June this was 17% in the metros, 24% in the cities/towns and 29% in the rural areas. By July these proportions had fallen to 13% in the metros, 16% in the cities/towns and 20% in the rural areas. In other words, hunger had declined in all types of area, but was still worse in the rural areas.
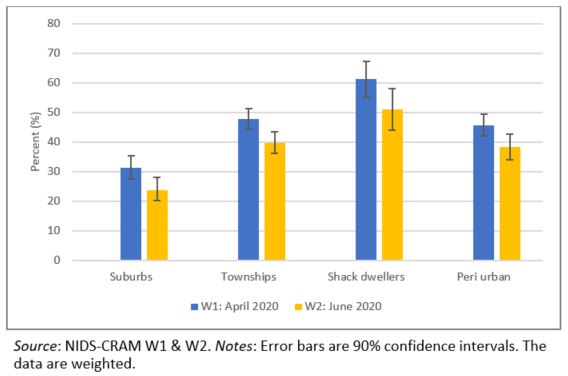
Turning to the differences within cities, the proportion of respondents who said their household had run out of money to buy food in April was 31% in the suburbs, 48% in the townships and 61% in the shack areas, as shown in figure 3. (Shack-dwellers were noticeably worse off than rural respondents. This adds to the concern, noted above, that far fewer shack-dwellers receive government grants of any kind than people living elsewhere.) By June, these proportions had fallen to 24% in the suburbs, 40% in the townships and 50% in shack areas.
Figure 3: Percentage of adults reporting their household
ran out of money to buy food
In terms of the second measure – the proportion of urban respondents who said that someone in their household had gone hungry in the last seven days – the data show that in May/June this was 11% in the suburbs, 22% in the townships and 32% in the shack areas. By July these proportions had fallen to 7% in the suburbs, 16% in the townships and 22% in the shack areas. The differences between urban neighbourhoods clearly remained very large, though.
The extent of hunger improved everywhere, although the gap between the shack-dwellers and other groups was still large. Shack-dwellers also continued to be worse off than rural residents, and with less social relief.
What can policymakers do about this?
Summing up: government social grants have helped to offset the large economic gaps between places. Still, the incidence of hunger remains much higher in informal settlements, townships and rural areas than in the suburbs.
It is important to recognise that different parts of the country face different challenges. Poor communities have borne the burden of the economic slump. Treating unequal places in the same way won’t diminish the gap between them. Uniform, place-blind measures have been insensitive to these variations and had unintended consequences in amplifying inequalities. Nationwide programmes need complementary efforts to boost jobs and livelihoods in vulnerable urban and rural areas. This means targeting places as well as people in tackling poverty and unemployment.
Short-term measures include:
- Ensure that all households that are entitled to social assistance from the government are helped to apply for it.
- Extend the life of the government’s temporary relief schemes to cover shortfalls in household income and to mitigate hunger.
- Support local efforts to build solidarity and cohesion across communities through all kinds of voluntary and collective action.
- Make existing data and evidence publicly available and improve the quality of information and intelligence on local economic and health conditions.
Medium-term measures include:
- The government needs to move beyond blanket national policies and blunt responses to the pandemic towards a more sensitive and differentiated approach that recognises the different risks facing different areas.
- It is essential that municipalities, provincial governments and national departments work together on targeted action plans to improve economic conditions in vulnerable urban and rural areas.
- Action plans must be developed to accelerate the upgrading of well-located informal settlements and backyard shacks and to de-risk their high population densities through investment in buildings and essential infrastructure.
References
Spaull N et al (2020) NIDS-CRAM Wave 1 Synthesis Report: Overview and Findings. NIDS-CRAM Working Paper 1.
Visagie J & Turok I (2020) The Uneven Geography of the Covid-19 Crisis, NIDS-CRAM Policy Paper 14.
Download article
Post a commentary
This comment facility is intended for considered commentaries to stimulate substantive debate. Comments may be screened by an editor before they appear online. To comment one must be registered and logged in.
This comment facility is intended for considered commentaries to stimulate substantive debate. Comments may be screened by an editor before they appear online. Please view "Submitting a commentary" for more information.