Socio-economic class in South Africa: playing snakes and ladders with loaded dice
Introduction
Poverty is experienced not only at a point in time, but also over time. Households move into and out of poverty, remain trapped in poverty, or succeed in keeping their heads above water. In a world of risk and uncertainty, poverty follows the course of a game of snakes and ladders. However, this is not a game of simple chance: factors related to advantage/disadvantage such as race, education and geographic location load the dice in favour of some and stack the odds against others.
Cross-sectional surveys and analyses remain blind to both the ’snakes’ that cause households or individuals to fall into poverty and the ’ladders’ which facilitate their escapes from poverty. However, the availability of a ‘panel study’ spanning nine years allows researchers to shed light on these phenomena. The National Income Dynamics Study (NIDS) has interviewed a nationally representative sample of about 28 000 South Africans every two years between 2008 and 2017. The resulting five rounds of repeated survey data – also referred to as ‘waves’ – provide researchers with an opportunity to understand such dynamic patterns of poverty.[1]
The availability of this data also allows researchers to trace how advantage and disadvantage – which define and structure people’s chances of upward and downward socio-economic mobility – are unequally distributed across the population. Our analysis of economic mobility opens a window to understand the implications of the structure of socio-economic classes. Thus we explicitly link the dynamics of poverty and socio-economic stratification.
The dynamics of poverty in South Africa
By obtaining detailed information from the same individuals at five instances over a nine-year period, we are able to quantify the extent to which their poverty is sustained over time as opposed to being a transient, short-lived state. At the same time, one gets an indication of the key factors which cause poverty to persist.
In Figure 1, we divide the balanced sample of individuals who were successfully interviewed in all five survey waves (i.e. the panel population) into six groups. This is done according to the number of times that they are observed to be poor – referred to as poverty ‘spells’.[2] We then compare these patterns of poverty across several demographic groupings (race, gender, education and location).
Figure 1 shows how the number of poverty spells differs amongst people. This is illustrated in five segments in the diagram. The first segment on the left shows, from the top, the proportions of the total population that experienced from zero up to 4 or 5 poverty spells between 2008 and 2017. Only a small portion (14.7% - the lightest blue at the top) remained consistently non-poor through the five waves. In contrast, 36.1% of all persons in the panel remained consistently below the poverty line in all five waves (the darkest blue component), with an additional 21.3% being poor in four out of five waves.
Figure 1: Number of poverty spells by various characteristics

However, these patterns differ dramatically according to demographic and geographic criteria. The other segments of figure 1 show, respectively, that black South Africans, those with low levels of education, living in female-headed households, and living in rural areas are substantially more likely to be subject to poverty that persists over time – i.e. they experienced several spells of poverty – compared to whites, those with secondary or tertiary education, in male-headed households, and living in urban areas.
Being able to draw on a study that spans several years reveals another important result: poverty affects far more individuals at one time or another than can be picked up in standalone, cross-section surveys. While StatsSA recently estimated that 55.5% of the population was poor (StatsSA 2017), a cross-sectional estimate such as theirs cannot pick up that over time many more people are affected by poverty at different points in time. Figure 1 shows both that one third of the poor remained persistently poor, but also that 85% of the survey sample were observed to be poor at least once during the nine-year period under study.
In addition, these findings are worrying because economic vulnerability and risk create stress; this can generate a low-income trap by reducing people’s economic choices[3] (Cafiero & Vakis 2006; Dercon 2006). Again, African households, female-headed households, households headed by those with low levels of education, and rural households are disproportionately exposed to high levels of economic vulnerability.
Even though government grants play an important role to reduce the depth of poverty and ensure a minimum standard of living for those in need, such grants are usually insufficient to lift a family above the poverty line. Accordingly, variations in labour-market income explain most of the transitions into and out of poverty. In this regard, the type of employment of the head of the household, especially its stability and duration, is important in predicting a person’s risk to poverty.
Figure 2 illustrates this relationship. It shows the number of poverty spells experienced by individuals (in the survey period 2008-2017) according to the employment status of the head of the household at the start of the survey period.
Figure 2: Number of poverty spells by initial employment status of the household head
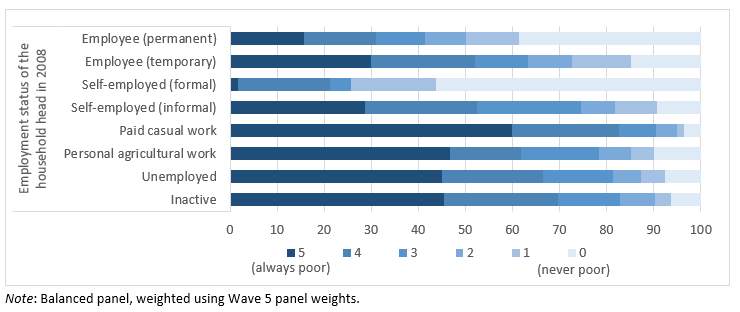
Members of households where the head is permanently employed or runs a formal-sector business face a significantly lower risk of poverty than members of other households (i.e. the first and third horizontal bars have relatively small dark blue components). On the contrary, casual forms of work are associated with a significantly higher incidence and duration of poverty. These employment patterns are closely related to the demographic attributes shown in Figure 1: household heads with higher levels of education and who live in urban areas have the best chances to be in a stable labour-market position that provides economic security.
Socio-economic stratification and class profiles
Given the unequal distribution of poverty risks across the population, we suggest a framework that links socio-economic classes to an analysis of the probability of getting into and out of poverty (for details, see Schotte et al. 2018).
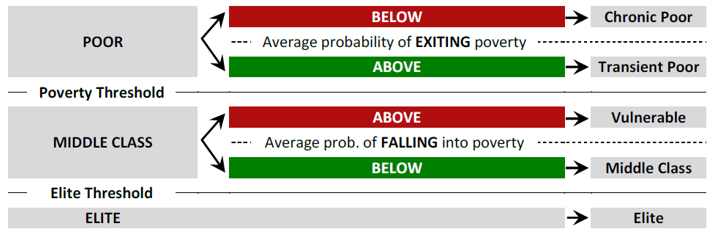
We start with a standard division of society into three socio-economic classes: the poor, the middle class and the elite. We consider people as being poor when they are deprived in terms of their basic food or non-food needs; that is, if they fall below the national poverty line as measured in terms of the cost of basic needs. In line with this, the elite are those who enjoy a standard of living well above the national average.
Next we add nuance to this class structure. Among the poor, we distinguish between two sub-groups: (a) those with below average chances of getting out of poverty and thus a comparatively high risk that their poverty will persist (whom we term the chronic poor) and (b) those with above average chances of making it out of poverty (the transient poor). Analogously, within the middle class we distinguish between those with an above average risk of slipping into poverty (the vulnerable) and the more economically stable and secure middle class – the ‘actual’ middle class – who have a below average risk of becoming poor.[1] Figure 3 shows the structure of these five classes in a diagram.
Figure 3: Schema of socio-economic stratification
To apply this class structure to our survey data, we fit a model of poverty transitions to the panel data. The model estimates the risk to future poverty based on an individual’s current poverty status and household characteristics. In this way, for each individual we predict the probability of moving into or out of poverty.[1] Then, based on these probability scores, we sort individuals into each of the five classes. Figure 4 shows the shares of each of the five classes in the population in each of the survey years.
Figure 4: Socio-economic class sizes 2008–2017

We see that, between 2008 and 2017, on average, about one out of four (24%) South Africans could be classified as being in either the stable middle class or the elite class. This is a considerably smaller share than most other studies suggest (see Visagie 2013 on Econ3x3).
Moreover, with an average combined share of 26.8%, the transient poor and the vulnerable middle class constitute a considerable share of the population.[1] For both of these groups that straddle the poverty line, income levels are highly volatile and difficult to sustain. This volatility is closely linked to their unstable position in the labour market, as discussed below. Almost every second member of the vulnerable middle class had fallen into poverty between two survey years. The ‘actual’ middle class, by contrast, had much more stability. About four out of five members of the stable middle class had either retained their class status or had moved into the elite class, while only about one out of ten had fallen into poverty.
Among the chronic poor, which made up 50% of the population between 2008 and 2017 and accounted for 80% of total poverty, only one out of ten members managed to escape poverty – whereas among the transient poor, four out of ten individuals were observed to have escaped poverty in at least one survey round.
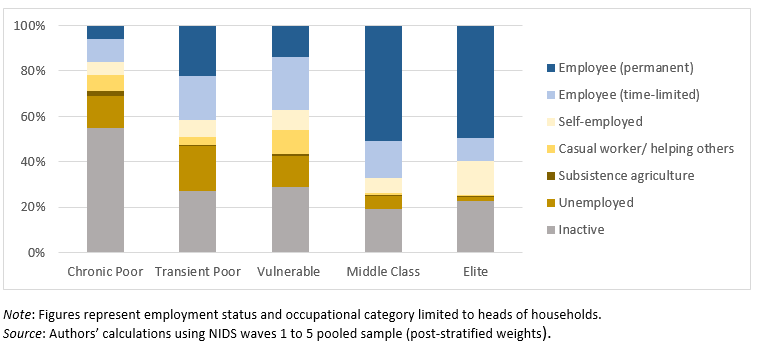
The nature of their involvement in the labour market is a key distinguishing factor of classes – but also reveals similarities between the classes. Figure 5 shows the size of sub-groups within each class in terms of the employment status of the head of the household. For example, the first vertical bar illustrates that heads of chronically poor households (and to a lesser extent, those of transient poor and vulnerable households) are far more likely to be economically inactive or unemployed than those in the middle class and elite. As expected, precarious forms of work such as casual work and employment without a permanent employment contract make up the largest share of jobs among the poor and vulnerable. Among the middle class and elite, 80% of all household heads who are employed have a permanent contract.
Moreover, the heads of chronically poor households are most likely to be employed in elementary occupations. Elementary occupations and service and sales occupations are also the main occupations of household heads in both transient poor and vulnerable households (and in this regard these two classes once again are very similar). As expected, white-collar occupations are most common in middle class and elite households.
Figure 5: Socio-economic classes and economic activities of household heads, 2008–2017
Conclusion
This research brings into focus several factors that affect the upward and downward mobility of people in different socio-economic classes. It illustrates how the risks to getting into or out of poverty are unequally distributed across the population and, consequently, how mobility patterns differ. This allows us to understand how deeply-rooted inequalities have real consequences in determining the socio-economic trajectories of individuals.
The analysis points to potential ways in which policy can help people escape from poverty for sustained periods. This will allow more people to enter the ranks of the stable middle class. The crucial role of the labour market is clear:
- Employment status and the type of employment are key determinants of whether people are resilient or vulnerable to poverty.
- Closing the skills gap and increasing both the quantity and quality of jobs are needed to lift larger parts of the population into the middle class and prevent backslides into poverty.
- Policymakers are likely to face an important trade-off between flexible labour-market arrangements that foster job creation, and the creation of fewer but better protected and more stable jobs that will allow more people to permanently escape from poverty than are currently able.
It is clear that persistent poverty still dominates the overall economic landscape. Social grants will remain indispensable for the survival of those locked in chronic poverty. Improving access to employment opportunities through better access to healthcare, education, finance and transport infrastructure remain important areas for policy.
References
Cafiero C & Vakis R (2006) Risk and vulnerability considerations in poverty analysis: Recent advances and future directions, Social Protection Discussion Paper 0610. Washington DC: World Bank Publications.
Dercon S (2006) Vulnerability: A micro perspective. In Bourguignon F, Pleskovic B & Van der Gaag J (Eds) Securing development in an unstable world. Washington DC: World Bank Publications.
Lopez-Calva LF, Rigolini J & Torche F (2016) Is there such thing as middle class values? Class differences, values and political orientations in Latin America. Journal of Globalization and Development 7(2).
Schotte S, Zizzamia R & Leibbrandt M (2018). A poverty dynamics approach to social stratification: The South African case. World Development 110: 88–103.
Statistics SA (2017) Poverty trends in South Africa: An examination of absolute poverty between 2006 and 2015. Report No. 03-10-06. Pretoria: Statistics South Africa.
Zizzamia R, Schotte S & Leibbrandt M. (2019) Snakes and ladders and loaded dice: Poverty dynamics and inequality in South Africa between 2008-2017. SALDRU Working Paper 235, Version 1 or NIDS Discussion Paper 2019/2. University of Cape Town, or SA-TIED Working Paper 33, Helsinki: UNU-WIDER.
[1] While these two groups are located on either side of the poverty line, they are strikingly similar in terms of their average household characteristics. The households in these groups are similarly sized, both rely heavily on the labour market for income (with 72.58% and 74.58% respectively relying primarily on labour-market income), are distributed geographically in similar proportions between rural and urban areas, have comparable levels of education and are both predominantly African (with a smaller share of Coloured members).
[1] For details on this predictive model, see Zizzamia et al. (2019).
[1] The central idea to identify the middle class is based on a latent measure of economic security or (in)vulnerability to poverty was pioneered by López-Calva and Ortiz-Juarez (2014). Our approach aims to expand on their work by using a more comprehensive model of poverty transitions that accounts for state dependence and additionally allows to differentiate between transient and chronic poverty.
[1] For example, if those vulnerable to poverty, in order to minimise risks, are forced to engage in economic activities which are low-risk and guarantee constant but low returns.
[1] NIDS is the first national panel study in South Africa. The study began in 2008 with a nationally representative sample of over 28,000 individuals in 7 300 households across the country. Since then, the survey has been conducted with these same household members approximately every two years resulting in five sets of repeated survey data (2008, 2010/11, 2012, 2014/15, 2017).
[2] Poverty is understood as being deprived of basic food or non-food needs. Individuals are defined as poor if their household’s consumption expenditure is below the national cost-of-basic-needs poverty line. The line is set at R1 136 in March 2017 prices, equivalent to $5.5 in 2011 purchasing power parity (PPP).
Download article
Post a commentary
This comment facility is intended for considered commentaries to stimulate substantive debate. Comments may be screened by an editor before they appear online. To comment one must be registered and logged in.
This comment facility is intended for considered commentaries to stimulate substantive debate. Comments may be screened by an editor before they appear online. Please view "Submitting a commentary" for more information.