Tax(i)ing the poor? Implications of our high commuting costs
Introduction
The fact that a substantial fraction of South African workers live far from their workplaces means that travel to work is costly in terms of time and money. This problem is partly a result of the apartheid and pre-apartheid policies that separated different racial groups, mainly by moving black, coloured and Indian households away from areas close to central business districts. High costs of commuting may contribute to the high rates of poverty, lower productivity and less time spent with the family.
In this article I investigate how much money and time South African workers spend getting to work and how this has changed between 1993 and 2013. I also estimate the effective reduction in hourly wages due to the time and monetary costs imposed on workers. Finally I explore the extent to which the direct public-transport subsidy provided by the South African government is targeted at low-income workers.
To undertake this analysis I use data from three nationally representative surveys to analyse changes in commuting patterns and commuting costs between 1993 and 2013 (see Kerr 2015 for more detail). The surveys are the 1993 PSLSD conducted by SALDRU[1] and the 2003 and 2013 National Travel Surveys (NTS) conducted by Statistics South Africa.
Background: commuting times in SA are extraordinarily high
South Africans spend an extremely long time getting to work. According to data from the 2003 National Travel Survey, black South Africans spent an average of 88 minutes per day commuting to and from work. This was just less than double the average commute time in the United States in 2002, a country known for its long commuting times and poor public transport.
On average, in 2003 white South Africans spent 54 minutes per day commuting (NTS 2003). This was 34 minutes per day less than the average for black South Africans – but the average for whites was still higher than the average in the US and all 23 EU countries listed by Stutzer & Frey (2008).
Ten years later, the 2013 South African National Travel Survey suggested that average commuting times had increased by a further 14 minutes for both black and white South Africans. These longer commuting times lead to much wasted time, lower productivity and higher frustration levels for many commuters.
How do commuters get to work?
Table 1 shows that driving and using minibus taxis were the two most important forms of commuting in 2013. Together, these two forms of transport account for just less than 50% of commuting. If car passengers are included, this amounts to around 57%. Walking, whilst important, has become a less common way of getting to work – only 20% of commuters walked to work in 2013 compared to 28% in 1993.
The data from Table 1 also suggests that directly state-subsidised public transport (train and bus) was used by less than 9% of the working population to get to work in 2013 (down from around 12% in 1993). It should be kept in mind that government also spends a lot of money on the road network which presumably benefits all motor vehicle commuters.
Table 1: Work travel mode by year (% of persons)
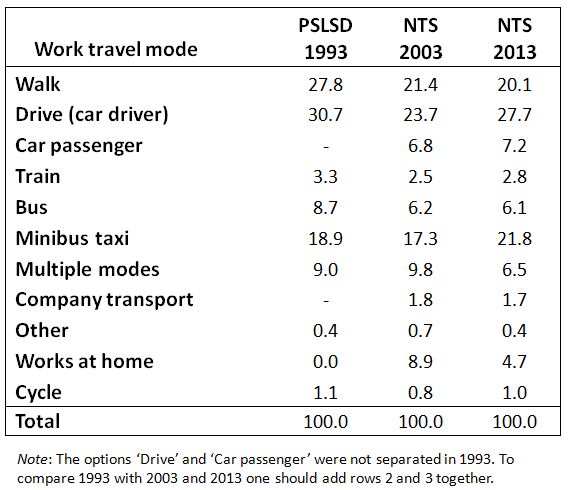
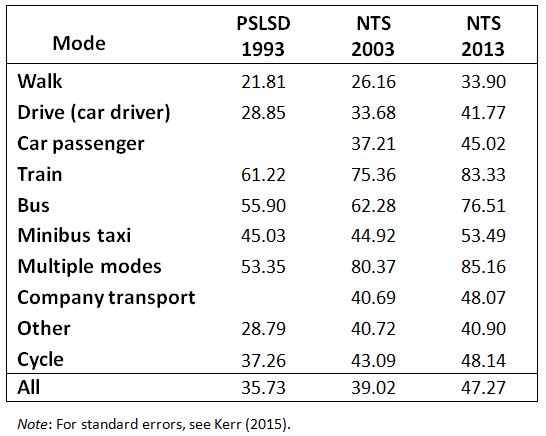
Table 2 shows the time spent commuting according to the mode of transport (one way). People who use public transport, i.e. those who travel by train and bus, generally spend much longer commuting than those who drive in cars (and actually most other modes of transport except ‘multiple modes’). Minibus taxi users also spend more time in transit than those in cars, but considerably less than those using the bus or train.
The table also shows that commuting times have generally been increasing for all modes of transport between 1993 and 2013.
Table 2: Mean one-way travel time by mode and year
The monetary costs of getting to work
Commuting costs money as well as time. Data from the 2013 National Travel Survey show that commuters that drive, use taxis or multiple modes of transport (usually a combination of bus, train and taxi) to get to work spend an average of more than 15% of their gross income getting to work.
Time and monetary costs of transport can be thought of as a kind of ‘tax’ that commuters pay on the incomes that they earn from work. This ‘tax’ varies between modes of transport (and levels of income). High costs of commuting (in terms of time and money) can thus lower the returns to work and may decrease the number of people that are willing to work or look for work.
As an example, consider a full-time worker with a monthly income of R3 000 (not far from median earnings in South Africa), which amounts to an hourly wage of around R17. First, if R300 is spent on transport per month (not an uncommon amount for someone taking a publicly-subsidised bus), the net monthly income would be 10% lower (at R2 700) and the hourly wage net of transport costs would amount to R15.70.
Secondly, if we added two hours spent commuting per day (a little more than the average in 2013) to an 8-hour work day, then the effective hourly wages would come down to R12.50. This would equate to a 28% decline in hourly wages compared to the wages of an individual who paid no transport costs and spent no time commuting (for example those who work from home or who work very near to home).
Using the NTS 2003, I computed these effective ‘tax’ rates for the various forms of transport. For a full-time worker earning R3 000 per month, the median reduction in effective hourly wages once transport costs are subtracted and hours spent commuting are added is 26% for minibuses, 29% for train users, 31% for bus users and 39% for those using multiple modes.
These median values mean that more than half of the workers using several modes of transport have their hourly wage reduced by 40% or more due to transport costs! Similarly, the reduction is 26% or higher for half of all minibus users.
Does the subsidisation of public transport help?
The implicit ‘tax’ effect of transport costs and times could be reduced by transport subsidies. Here I consider the impact of existing government subsidies on the users of different modes of transport, comparing low-income and higher-income commuters.
The National Land Transport Transition Act of 2000 states that public transport subsidies should be targeted at “currently marginalised users and those who have poor access to social and economic activity.” Given this goal, it is of interest to explore the extent to which spending on public transport is targeted at low-income individuals.
Public subsidies are distributed to private bus operators, to the new Bus Rapid Transport systems in larger cities, to PRASA – the provider of intra-city train services – and to the Gautrain, which is largely targeted at middle-class users. Minibus taxi operations are not subsidised, but there is a taxi recapitalisation programme that pays an incentive when older, smaller taxis are scrapped, as well as a grant to purchase newer taxis. Taxis and buses also benefit from spending on the road network.
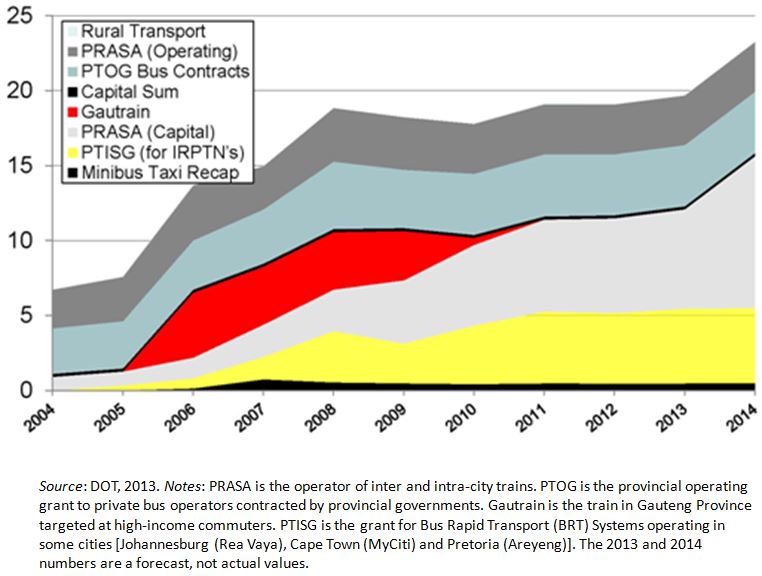
Table 1 above implies that minibus taxis carried around 71% of all commuters travelling by bus, train and/or taxi in 2013. Despite this, figure 1 (below) from the Department of Transport indicates that the vast majority of spending on public transport goes to the bus and train network (these figures exclude spending on the road network, which also benefits buses and taxis).
Minibus taxis receive only about 1% of the total direct public transport spending by the government in the form of the scrap-and-replacement allowance for old taxis. In figure 1, this can be seen in the thin black slice at the bottom of the diagram.
Figure 1: Public transport subsidies from Dept. of Transport (DOT)
.
Given the goal of the South African state to subsidise public transport for marginalised users, it is of interest to explore the extent to which spending on public transport is targeted at low-income individuals. Table 3 shows the distribution of modes of transport in terms of the quintile of earnings from employment in 2013. Row 1 shows that, for the workers in the lowest 20% of the income distribution (the first, poorest quintile), 45% walked to work in 2013 – as opposed to 7% of those in the highest (richest) 20% of the income distribution.
Table 3: Work travel mode by income quintile in 2013
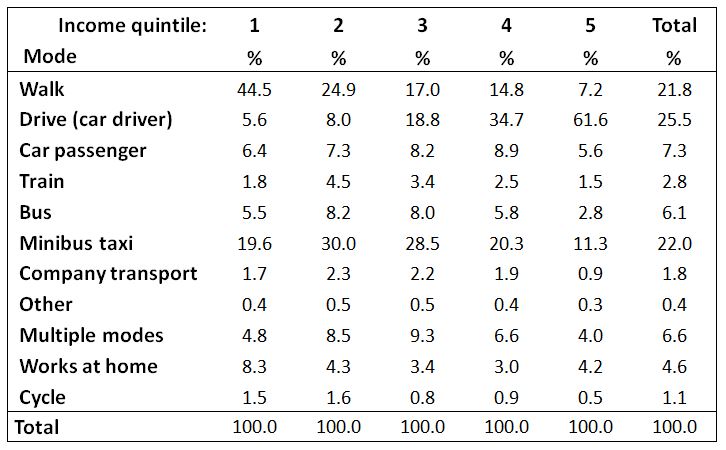
Row 2 shows that driving to work is done mostly by the higher income groups, while a minibus taxi is the most common way in which those in the second and third quintiles (row 6) commute to work. From rows 1 and 10 it is clear that a majority of those in the lowest income quintile either walk to work or work at home. Only 7.3% (= 1.8 + 5.5%) of those commuters in the lowest quintile use buses or trains which are likely to be subsidised by the state. (In comparison, this value is 12.7% in quintile/column 2, 11.4% in quintile 3, 8.3% in quintile 4 and 4.3% in the top quintile.) This means that government’s transport subsidies seem to benefit those in the lower middle of the income distribution (quintiles 2 and 3) most.
The table answers the question in the title of this piece: taxis actually transport a large fraction of commuters across all incomes, rather than just the poor, although they certainly do transport a substantial fraction of low-income workers.
Conclusion
The time and monetary costs of commuting in South Africa are high. This means that commuters face large effective taxes on commuting. Public transport users in particular face extremely large reductions in their effective hourly wages (i.e. net of monetary travel costs and adding in commuting times).
The direct government public transport subsidy is paid to bus operators and PRASA and not to minibus taxis, which transport the largest share of public transport users. Indeed, between 1993 and 2013 commuters have shifted even more towards using minibus taxis (and using private cars) and away from walking, buses and trains. (All commuters benefit from public spending on the road network but I have not analysed this spending.)
Policies that improve public transport, that encourage the densification of cities and towns, that target subsidies for public transport better and that allow poor commuters to live closer to work could contribute to reducing the cost and times of commuting. That would increase the effective wages received by workers.
References
Kerr A. 2015. Tax(i)ing the poor? Commuting costs in South Africa. REDI working paper 12.
Stutzer A & Frey BS. 2008. Stress that doesn't pay: the commuting paradox. Scandinavian Journal of Economics 110(2): 339-366.
[1] PSLSD = Project for Statistics on Living Standards and Development.
SALDRU = Southern African Labour and Development Research Unit, University of Cape Town.
Download article
Post a commentary
This comment facility is intended for considered commentaries to stimulate substantive debate. Comments may be screened by an editor before they appear online. To comment one must be registered and logged in.
This comment facility is intended for considered commentaries to stimulate substantive debate. Comments may be screened by an editor before they appear online. Please view "Submitting a commentary" for more information.