How basic education has improved in the Western Cape
Introduction
Since 2015, there has been a remarkable decline in repetition in Western Cape public schools. Particularly encouraging is that it is not associated with any decline in performance in the Western Cape Systemic Tests, matric examinations or international tests. This points to a considerable improvement in the efficiency of the Western Cape system, already the province with the lowest repetition rates.[1] The Western Cape experience may hold important lessons for other provinces. Anecdotally, officials ascribe this improvement to targeted interventions to support schools and learners in need, and a more flexible promotion policy.
This study analysed a longitudinal dataset for the period 2007 to 2019 to track a cohort of learners from grades 1 to 12, using the individual learner-unit record data system available in the Western Cape’s Central Education Management Information System (CEMIS). Learners enrolling in grade 1 in 2007 were followed for 12 years (a school cycle) until 2018, and one year thereafter to 2019 for those who may have repeated. However, they could not be completely followed if they repeated more than once. Learner-unit record data makes it possible to analyse learner flow patterns in terms of who repeats, drops out, or progresses, which is not possible with the more conventional aggregated datasets typically available in education. Using unit record data in this way also holds great promise at the national level, where the relatively new LURITS (Learner Unit Record Information and Tracking System), a longitudinal dataset similar to the Western Cape’s CEMIS, is starting to track learners over time, allowing similar analysis and making it easier to introduce policy interventions targeted at learners with specific attributes in order to improve progression through the school system.
Creating a longitudinal data system
Unit-level learner records make it possible to answer key questions such as: “What is the profile of the learners who dropped out of the system, or who progressed without any repetition?” In CEMIS datasets, the learners’ unique identifier number, remains with them throughout their school career. This makes it possible to follow each learner over time, not only within the same school but also across schools or districts within the province to determine progression without repetition, repetition, and dropping out. In this report, ‘dropping out’ refers to those who left the Western Cape public education system, but includes some learners who may have moved to private schools or to other provinces.
Research methods
Repetition or retention is the practice of holding back children who have not mastered the curriculum and thus do not meet required academic standards.[2] The high rate of grade repetition has been labelled an “almost unnoticed problem in the South African education system”.[3]
Most empirical evidence on repetition in South Africa comes from annual school surveys that collect aggregated data from schools. But such data often understate repetition and also don’t allow an analysis of the progression of individual learners and how that varies by factors such as gender, home language, age, or race. This study used the Western Cape’s anonymised learner-unit records or CEMIS data from 2007 to 2019, created as separate datasets, linked through a common unique field (CEMIS learner ID) to create a longitudinal dataset.
Cross-sectional analysis of CEMIS data (2007-2019)
Even though the data presented in Figure 1 shows only a series of cross sections of enrolment by grade, it nevertheless provides a good indication of trends and patterns in the Western Cape education cycle that have been quite stable across time. In the first ten grades, the system is relatively successful in keeping learners in school. However, the steep decline after grade 10 is symptomatic of the whole South African school system, which retains most learners through primary school, but then sees high dropout rates in the secondary phase.
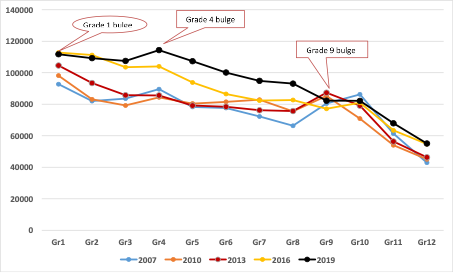
Figure 1: Enrolment in public schools in the Western Cape by grade and for selected years
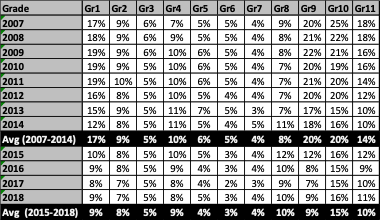
The relatively high repetition rates in the Western Cape, specifically in grades 1, 4, 9, and 10, show up as enrolment bulges in these grades in Figure 1. But visual inspection of Table 1 shows a striking reduction in repetition rates in recent years in grades 1 and 9 and to a lesser extent also in grades 10 and 11 after 2015. Interviews with officials indicate that the Western Cape used targeted interventions to address high failure rates, leading to significant decreases in repetition rates since 2015. For this reason, some of the further analysis will accentuate the differences in repetition and progression in the earliest years for which we have data compared to the most recent cohorts we can track for a sufficiently long period.
Table 1: Repetition rates in public schools in the Western Cape by grade and year, 2007-2018
Longitudinal cohort analysis
Promotion, repetition and dropout determine the internal efficiency of an education system. Longitudinal cohort analysis offers the best perspective on internal efficiency.
Table 2 summarises how the 2007 grade-1 cohort progressed through the system. In 2007, 92 731 learners started in grade 1; some may have been repeaters[4]. In 2008, 71 069 of those same learners were in grade 2, in other words they had progressed successfully, while 16 214 repeated grade 1. This means 87 357 learners of the 2007 grade-1 cohort were still in the school system in 2008, implying that 5 374 grade-1 learners had dropped out of the Western Cape public school system between 2007 and 2008, a surprisingly large dropout that needs further investigation.[5]
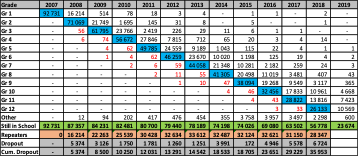
Table 2: Progression of learners enrolled in grade 1 in 2007 for the period 2007-2019
Progression of the 2007 grade 1 cohort through primary school phase, 2007-2013
Table 2 shows that by 2013, 44 058 learners of the 2007 grade-1 cohort had progressed without any repetition to grade 7 (the end of primary school) and were therefore still in their appropriate grade[6], while there were 33 612 learners from the 2007 grade-1 cohort still in the system who had repeated at least once. Of these repeaters, 23 670 were in grade 6, i.e., one year behind, 9 189 were in grade 5 (two years behind), 712 in grade 4 (three years behind), 29 in grade 3 (four years behind), eight in grade 2 (five years behind) and four still in grade 1 (six years behind). Some of these who appear to have repeated multiple times likely reflect data errors in CEMIS, although it may in part also reflect deviations from the repetition policy, which specifies that learners should not be held back more than once in a school phase. The phases are the Foundation Phase (grades 1-3), Intermediate Phase (grades 4-6), Senior Phase (grades 7-9, thus stretching across the primary-secondary boundary), and the Further Education and Training (FET) Phase (grades 10-12). Data errors are also responsible for the small number of observations below the table’s diagonal, e.g. the 56 learners in grade 3 in 2008 who had been in grade 1 the year before, and even six learners who were recorded in grade 4 in 2008 after being recorded in grade 1 the year before.
As Table 2 shows, 44 058 of the original grade-1 cohort in 2007, or 48%, successfully progressed to grade 7 in 2014 without repeating. The 33 612 members of the 2007 grade-1 cohort who were still in the system but had repeated at least one grade in the period 2007-14 constitute 36% of the original group. This implies that 84% of the original cohort of 2007 were still in the school system in 2013. Table 2 shows that 14 542 learners had dropped out of the Western Cape public school system, or 16% – a surprisingly high ‘dropout’ for primary school, something that needs further investigation.[7]
To investigate the effect of the recent (post-2015) reductions in repetition rates, we will track two 2016 cohorts – a primary and a secondary cohort – to compare their on-track progression with that of older cohorts. This allows only a four-year window, as our CEMIS data only reaches 2019.
Enhanced performance and efficiency improvement in the primary phase
Of the 92 731 learners in the 2007 grade-1 cohort, 16 214 (17%) repeated once or more in the following four years, while only 10 395 (9%) of the 2016 grade-1 cohort repeated. Of the 2007 cohort, only 56 672 (61%) had progressed to grade 4 without any repetition, while 81 535 (72%) of the 2016 grade-1 cohort progressed to grade 4 by 2019 – a significant improvement in internal efficiency. The greater on-track grade progression in Figure 3 is a good indicator of system improvement.
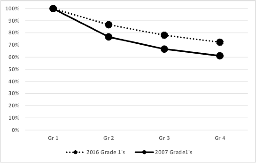
Figure 3: On track progression for the 2007 and 2016 Grade 1 cohorts
Progression of the 2007 grade-1 cohort through secondary school phase, 2014-2019
As Table 2 shows, 41 305 or 45% of the original grade-1 cohort in 2007 successfully progressed to grade 8 (the start of secondary school) in 2014 without ever repeating. The 32 487 learners of that cohort who were still in the system but had repeated once or more constituted 35%. This implies that 80% of the 2007 cohort were still in the school system in 2014. On the other hand, 18 533 or 20% had dropped out of the Western Cape public school system - a surprisingly high proportion, though it needs to be re-emphasised that some of this may not be related to dropping out of school. Learners may have moved to another province or enrolled in independent (private) schools.
Looking at the full 12-year period, only 26 133 or 28% of the 2007 grade-1 cohort were on track in 2018 and had progressed appropriately to grade 12. In 2018, 28 347 or 31% of this cohort who had repeated at least once were still in the system: 13 816 in grade 11, i.e. one year behind, 10 961 in grade 10, i.e. two years behind, and the rest three or more years behind. But of the original 2007 grade-1 cohort, a total of 35 953, or 39%, had dropped out of public schools in the province.
Table 2 also shows that in 2019, one year after the usual 12 years that it takes to reach grade 12, 23 674 (26%) of the original 2007 cohort were still in public schools, of which 10 569 were in grade 12 (implying they reached matric one year late).
Enhanced performance and improvement in the secondary phase
Table 1 shows a significant decrease in repetition rates after 2015, including grade-9 learners. We further investigated flow-through rates of grade-9 learners to determine the impact and consequence of these lower repetition rates by comparing flow-through patterns of the 2010 grade-9[8] cohort with the 2016 grade-9 cohort.
Three years after they were observed in grade 9, i.e. in 2013, 16 920 (20%) of the earlier cohort were still in school but had repeated at least once; in contrast, only 6 300 (8%) of the more recent grade-9 cohort had repeated before 2019. Of the earlier cohort, 34 237 (40%) had progressed to grade 12 in three years without repetition, while a much higher proportion (41 445, or 54%) of the more recent cohort had done so. Figure 4shows the extent to which on-track progression has improved. One key question that our study cannot answer definitively is: “Was the improvement because weaker students were allowed to flow through the system by reducing promotion requirements, or was it the result of the overall improvement of the system?” Discussions with officials point to targeted interventions to improve progression. Moreover, this happened without the Western Cape’s performance declining in the matric examinations or in the annual provincial Systemic Tests. There was also no deterioration in performance in two important recent international assessments: PIRLS, which tested grade-4 learners on reading and literacy, and TIMSS, which tested Science in grade 9 and Mathematics in grades 5 and 9.
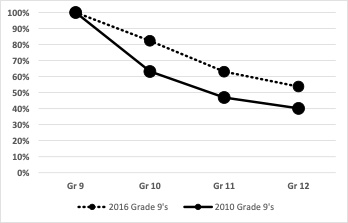
Figure 4: On track progression for the 2010 and 2016 Grade 9 cohorts
The knock-on effects of grade repetition
Longitudinal data makes it possible to track individuals through the system because each learner has a history, whereas the more commonly available EMIS[9] data based on an annual school survey does not allow such disaggregation. With longitudinal data we can investigate the effect of past repetition. To do this, we compared the progression of grade-9 learners who were on track in 2016 (the 2007 grade-1 cohort shown in Table 2) with other learners in grade 9 in 2016 who had repeated at least once. Of those on track in grade 9, 69% reached matric three years later, while only 36% of those who had already fallen behind by grade 9 did. Moreover, of the latter group, another 34% had already dropped out by 2019.
Grade repetition thus appears to be a precursor to dropping out early for most children who fall one or more years behind their cohort. We tracked learners for the full education cycle (12 years) who repeated once or were one year behind in grade 1, grade 4 and grade 9. Of those learners who fell one year behind in grade 1, 60% had dropped out by 2019; of those who were one year behind in grade 4, 57% had dropped out; and of those who were one year behind in grade 9, 34% had dropped out before reaching grade 12. It is thus evident that repetition, even in earlier grades, seems to be an early warning signal for school dropout in secondary grades.
These findings have important implications for policy. Sabates, Hossain and Lewin (2010) identified grade repetition among the predictors for dropping out: “(G)rade repetition, after a few years of primary school, may give schools a clear indication for targeting resources towards children who are at risk, in particular if these children are much older than the rest of their classmates”. They recommend that schools should identify these children and implement efforts to prevent them leaving the education system.
An earlier investigation on learner retention in the South African schooling system showed that “grade repetition has been identified as the single most powerful predictor of dropping-out. Studies conducted internationally have revealed that learners who have repeated a grade in their schooling career are most likely to drop out of school”.[10]
Conclusions
This longitudinal data analysis of learner flows through the Western Cape public education system has highlighted important issues. A clear message is that grade repetition is a precursor to dropping out of school without completing matric. This needs further attention from policy makers. The Western Cape experience is a useful example for other provinces that less strict repetition policy need not necessarily compromise quality as measured by performance on cognitive tests, matriculation exams, or international assessments.
Targeted interventions are necessary to improve quality of learning. Longitudinal data provides evidence that can assist policy makers in deciding where to target such interventions. Where repetition does occur, such data could also assist in identifying learners who need remediation to prevent the vicious cycle of high rates of repetition leading to slow progression and large dropout.
References:
Department of Education, Ministerial Committee on Learner Retention. 2008. Report of the Ministerial Committee on Learner Retention in the South African Schooling System. Pretoria: Department of Education.
Sabates, R., A. Hossain & K. Lewin. 2010. School drop out in Bangladesh: New insights from longitudinal evidence.CREATE Pathways to Access. Research Monograph No 49. University of Sussex: Brighton.
Van der Berg, Servaas, Chris van Wyk & Rebecca Selkirk. 2020. Schools in the time of COVID-19: Possible implications for enrolment, repetition and dropout. Stellenbosch Working Paper 20/2020. Department of Economics: Stellenbosch.
Van der Berg, Servaas, Gabrielle Wills, Rebecca Selkirk, Charles Adams, Chris van Wyk. 2019. The cost of repetition in South Africa. Stellenbosch Working Paper 13/2019. Department of Economics: Stellenbosch.
[1] Van der Berg, Van Wyk and Selkirk, 2020.
[2] Ndaruhutse, Brannelly, Latham & Penson, 2008.
[3] Van der Berg, Wills, Selkirk, Adams & Van Wyk, 2019.
[4] As no individual level data was captured in CEMIS before 2007, we cannot tell repeaters from new entrants in 2007.
[5] One explanation could be that some grade-1 learners exit the system quite soon, often because they are considered not school ready. When they return to grade 1 in the next year, it is possible they are given new CEMIS numbers, as school personnel may erroneously regard them as new entrants.
[6] Unless, of course, they were already repeating Grade 1 in 2007, something impossible to determine in the absence of CEMIS data for 2006.
[8] This earlier cohort would have been the grade-1 cohort of 2004, and could not be tracked through primary school, as the CEMIS data only dates from 2007.
[9] Education Management Information System
[10] Department of Education, 2008
Download article
Post a commentary
This comment facility is intended for considered commentaries to stimulate substantive debate. Comments may be screened by an editor before they appear online. To comment one must be registered and logged in.
This comment facility is intended for considered commentaries to stimulate substantive debate. Comments may be screened by an editor before they appear online. Please view "Submitting a commentary" for more information.