How much is inequality reduced by progressive taxation and government spending?
Introduction
South Africa has evidently made limited progress in reducing income inequality since the end of apartheid. In fact, since 1994 the Gini coefficient[1] has increased somewhat to 0.69 in 2011. South Africa’s levels of inequality are even greater than those in Brazil, another highly unequal country. For instance, 61.3% of aggregate consumption expenditure comes from the richest 20% of South Africans, compared to 55.7% in Brazil (StatsSA 2014; SEDLAC).
In a country as unequal as South Africa, it is critical to determine the progressiveness of the major fiscal policy instruments – i.e. to establish whether government spending and taxation separately and together are ameliorating or worsening the degree of inequality that would otherwise exist between individuals.
In order to make this determination one must ask two critical questions. First, who bears more of the burden of taxation and who benefits relatively more from the various forms of social spending – the poor, those in the middle or the rich? Secondly, what is the combined impact of taxes and spending patterns on inequality?
This article explores these questions by reporting on work by an international group of researchers (Inchauste et al. 2015) who studied these questions using the Commitment to Equity methodology developed by Lustig (Lustig & Higgins 2013). We also comment on the implications of their findings for policy.
Method of analysis
The study assesses how taxes and social spending programmes redistribute income to groups at different income levels. This involves comparing the income of different individuals in the population in terms of two measures:
- market income: income before paying taxes and receiving transfers; and
- final income: income after taxes, transfers and social spending (i.e. after redistributive fiscal efforts).
Market income is formally defined as the income a person receives from wages, salaries, capital, private transfers and contributory pensions before paying taxes – and not counting benefits from government spending. Final income is derived in steps (see figure 4 below).
The study actually interprets ‘transfers’ in their broadest sense: in addition to cash transfers (such as social grants), it includes an estimated monetary value of the receipt of basic services such as water and electricity, as well as the benefits of education and health spending. All these services can be regarded as in-kind transfers.
A next step is to determine the impact of these fiscal instruments (taxes and spending) on inequality by measuring the Gini coefficient before and after redistributive fiscal efforts. These effects are then compared with those of 12 middle-income countries, using the same methodology.
The main source of data is StatsSA’s Income and Expenditure Survey (IES) 2010/2011.[2] Unfortunately, not all taxes and spending categories could be incorporated into the analysis. The tax items included are personal income tax, payroll taxes (such as UIF contributions), value-added tax (VAT), specific excise duties on alcohol and tobacco and the general fuel levy. Together these comprise about 64.5% of general government tax revenue in 2010/11. Corporate tax (about 21% of tax revenue) is the largest category excluded from the analysis.
In the study, government spending mainly includes cash transfers and certain in-kind transfers (spending on basic services as well as on education and health). Together these items account for 43% of total government spending and 85% of social spending in the budget. The spending was apportioned to individuals on the basis of household survey data, using educational enrolment and utilization of health services. It was assumed that the actual benefit received from health and education is equal to the amount spent per capita (see Inchauste et al. 2015 for more detail).
It was not possible to incorporate differences in the quality of health and education services across the country. The estimated benefits of budget components such as defence or infrastructure (e.g. roads) could not be apportioned to different individuals or households and were excluded from the analysis.
Result 1: The tax system is mildly progressive
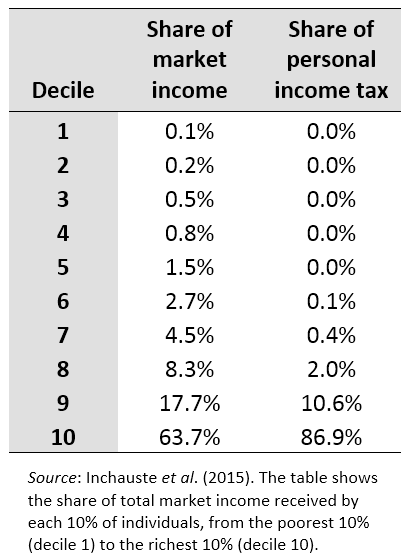
A progressive tax is one where individuals with higher taxable incomes pay progressively higher proportions of their income in tax. For the population as a whole, a tax is progressive if the combined share of the tax paid, for example, by the poorest 10% of the population is lower than their share of the aggregate income while the tax share of the richer income groups (e.g. the richest 10%) is higher than their share of the income.
The results indicate, first, that direct taxes (personal income tax plus payroll taxes) are progressive, since the richer income groups pay a proportionally higher share of total direct tax collections than their share of market income. As illustrated in row 10 of table 1, the wealthiest 10% of individuals earn about 63.7% of total market income, but they pay 86.9% of total personal income tax. The table also shows that 50% of the entire population – the poorest deciles 1 to 5 – do not earn enough to pay income tax (i.e. they earn less than the income tax threshold), while only a very small proportion of individuals in deciles 6 to 8 pay income tax (and only a very small share of total income tax).
Table 1: Distribution of market income and
personal income tax contributions
Secondly, indirect taxes (VAT, excises on alcohol and tobacco and the fuel levy[3]) are slightly regressive, notably in the bottom half of the income distribution. In 2010, the poorest 40% of individuals (rows 1 to 4 of table 2) contributed 5% of total indirect tax collections, compared with their share of 4.8% in total disposable income.
Table 2: Distribution of disposable income and indirect tax contributions
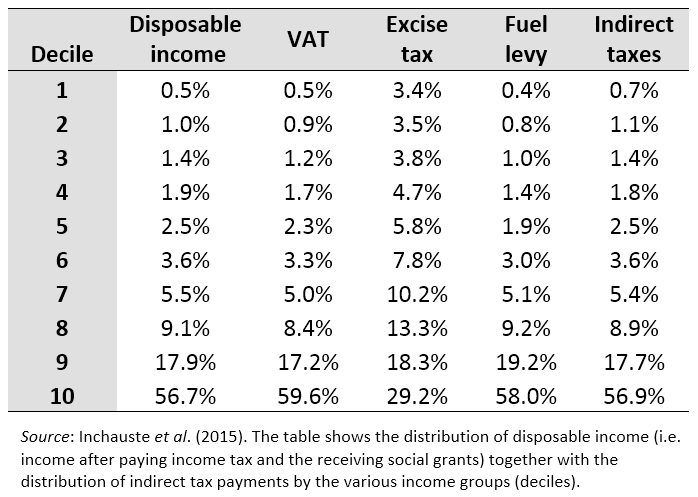
This regressiveness of indirect taxes at the lower end of the income distribution is largely a result of the impact of excise taxes on alcohol and tobacco; the analysis indicates that people earning a lower income spend a larger proportion of their disposable income on these products than richer people. On the other hand, fuel taxes and VAT are slightly progressive. The fact that VAT is not regressive can be explained by the zero rating of basic food items, as the poor tend to spend a greater percentage of their income on VAT-free items (and similarly for the VAT exemption of public transport).
Taken together, the mix of progressive direct taxes and slightly regressive indirect taxes generates a mildly progressive tax system. (One must keep in mind that corporate taxes are not included in the analysis.)
Result 2: Spending programmes are strongly progressive
Government spending is progressive if the share of the monetary value of government goods and services (i.e. ‘transfers’) going to the poor exceeds their share of aggregate market income – while the richer groups receive transfers of a value less than their share of market income.
The results show that government spending, and social spending in particular – through direct and in-kind transfers – are strongly progressive.
Cash transfers – especially the child support grant – are the most progressive of all spending programmes. The poorest 40% of individuals receive 69% of all cash transfers. These transfers also have significant value: for the poorest 10% of South Africans, transfers are worth 10 times more than their market incomes.
In-kind transfers in the form of free basic services, i.e. water, electricity, sanitation and refuse removal, are strongly progressive when assumed to be effectively targeted at the poor, while they are only slightly progressive when provided as an equal subsidy to everyone, irrespective of income.[4] The reality probably is somewhere in between, as some municipalities target services to the poor, while most claim they lack the required capacity to do so.
Education and health spending are progressive overall. Figure 1 illustrates how the poorest households comparatively receive much more benefit from spending on education than their share of market income.
Figure 1: Incidence of education spending
(share of market income deciles)
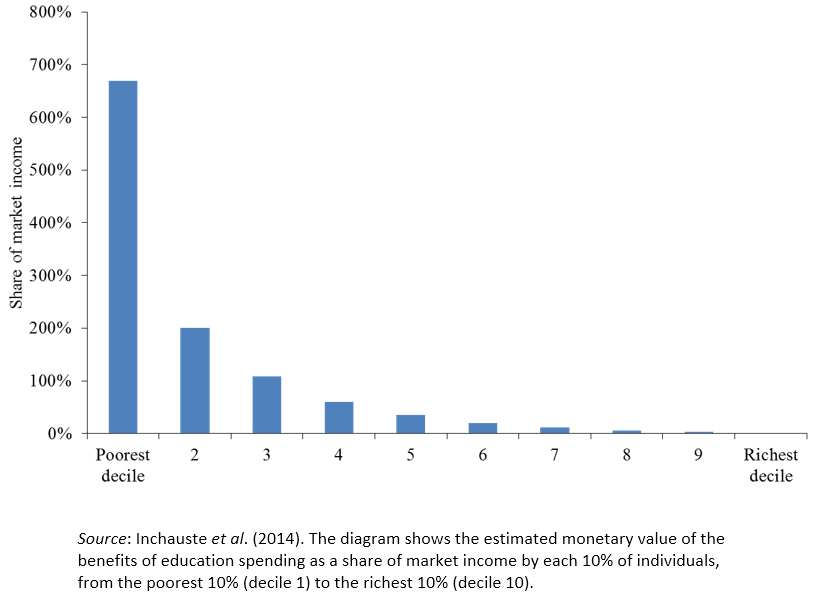
Most types of education are strongly progressive, including preschool, primary and secondary education. The exception is tertiary education (in particular university education, but also other post-secondary training) which is only slightly progressive.
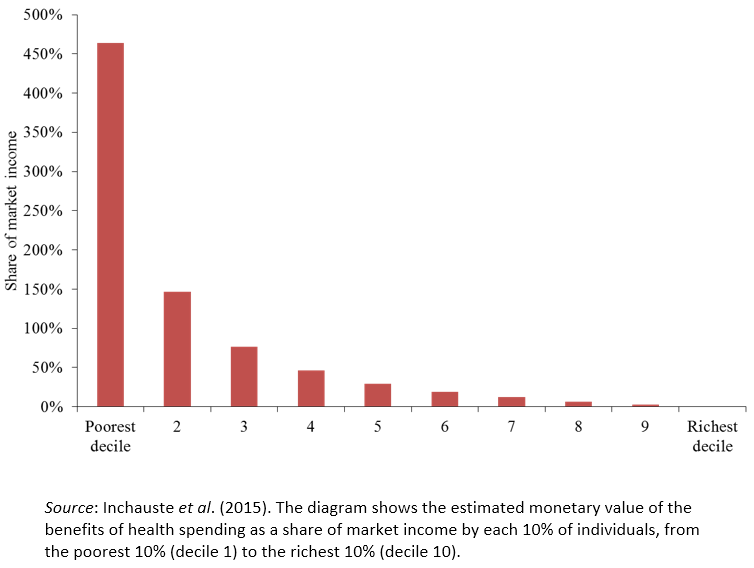
Health spending is strongly progressive. It is very well targeted at the poorest, since low income groups are more likely to attend public health facilities rather than private ones. Figure 2 illustrates how the poorest households comparatively receive much more benefit from health spending than their share of market income.
Figure 2: Incidence of health spending
(share of market income deciles)
Result 3: Together, progressive taxes and progressive spending reduce inequality significantly
Not only are South Africa’s main fiscal instruments progressive overall, the degree and structure of progressiveness is such that these instruments achieve significant reductions in income inequality.
The combined impact of taxation and government spending on income inequality can be estimated in terms of the reduction in the Gini coefficient due to taxation and social spending. South Africa’s Gini coefficient using market income is estimated to be around 0.77. However, for final income – i.e. when all taxes (indirect and direct, excluding corporate taxes) as well as key categories of government spending are taken into account – the Gini coefficient is estimated to be around 0.59 – a reduction of 0.18 Gini points.
This is a very large change. In fact, income inequality moves from a situation where the combined market income of the richest decile is more than 1 000 times that of the poorest, to one where the final income of the richest decile is about 66 times higher than that of the poorest.
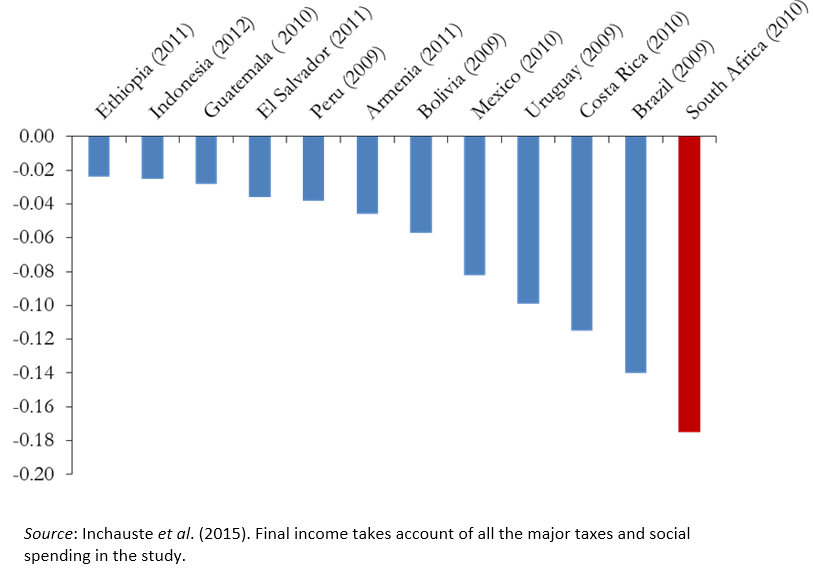
Moreover, this is the largest reduction in inequality of 12 middle-income countries analysed using the same method. The figure below illustrates that South Africa’s Gini reduction of almost 0.18 points compares favourably to Brazil’s at 0.14 or Mexico’s at 0.08.
Figure 3: Estimated fiscal-related reduction in Gini:
Final income vs market income (in Gini points)
Is the reduction in inequality enough?
On the whole, the evidence from 2010 shows that the fiscal system in South Africa is progressive overall: the tax system is mildly progressive and government spending is highly progressive. In other words, the rich in South Africa bear relatively more of the tax burden than the poor and the government redirects these resources more towards the poorest in society. This significantly raises their ‘final’ incomes. Without such a system, South Africa’s income inequality would be significantly higher than its current level.
Despite this progress, the level of ‘final’ income inequality in South Africa remains unacceptably high. Our level of income inequality after redistributive efforts is still higher than income inequality in all the other countries in the study before they apply redistributive fiscal policies.
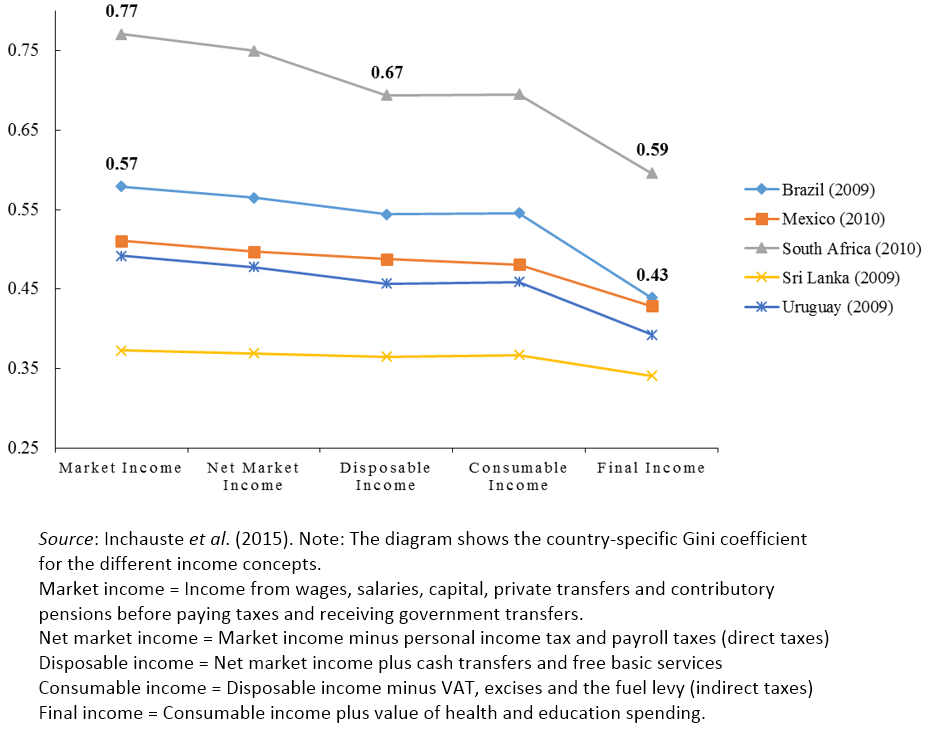
Figure 4 illustrates how the combined effect of taxation and government spending reduces South Africa’s Gini coefficient from 0.77 (for market income) to 0.59 (for ‘final’ income). However, it also shows that our Gini coefficient of 0.59 after fiscal redistribution compares poorly to the second most unequal country before fiscal redistribution – Brazil’s Gini of 0.57 for market income.
Figure 4: Gini coefficients for each income concept
Conclusion: policy options and limitations
Inequality in South Africa remains stubbornly high, even though progressive taxation and progressive government spending reduce inequality significantly. The analysis above may be interpreted to suggest that even greater fiscal redistribution is required. However, South Africa’s fiscal deficit and debt indicators signal that there is limited fiscal scope to spend more to achieve even greater redistribution. As a result of the challenging global economic climate since 2008, the implementation of countercyclical policy has meant that South Africa has increased its net debt burden of 22.9% of GDP in 2008/09 to 39.7% in 2013/14. With sluggish economic growth, the National Treasury (2014) expects this trajectory to only worsen.
Some would argue that South Africa should tax the rich even more, or target government spending to the poor even better. In this way, the fiscal system would become even more progressive. These may be valid assertions, and further research is important to determine the consequences of such policies on outcomes such as growth, unemployment, poverty and economic efficiency.
Nevertheless, addressing the challenge of income inequality in a way that is consistent with fiscal sustainability will require higher quality – and more efficient – public services.
It will also require interventions to achieve more inclusive economic growth to address the need for employment and higher incomes at the lower end of the income distribution (see examples in the articles of Donaldson, Econ3x3, October–November 2014). Fundamentally it is essential to attain better outcomes in terms of the initial distribution of wages, salaries and capital income (market income). Fiscal redistribution alone is unlikely to achieve the desired reductions in inequality.
References
Inchauste G, Lustig N, Maboshe M, Purfield C & Woolard I. 2015. The Distributional Impact of Fiscal Policy in South Africa. Policy Research Working Paper 7194. World Bank Group: Poverty Global Practice Group & Macroeconomics and Fiscal Management Global Practice Group.
Inchauste G, Lustig N, Maboshe M, Purfield C & Woolard I. 2014. South Africa Economic Update: Fiscal Policy and Redistribution in an Unequal Society. Presentation. World Bank Group, 6 November 2014. (Available on request from the authors.)
Lustig N & Higgins S. 2013. Commitment to Equity Assessment (CEQ): Estimating the Incidence of Social Spending, Subsidies and Taxes – Handbook. CEQ Working Paper No. 1, Center for Inter-American Policy and Research and Department of Economics, Tulane University and Inter-American Dialogue.
National Treasury (2014). Budget Review 2014. Pretoria: National Treasury.
SEDLAC (Socioeconomic Database for Latin America and the Caribbean), CEDLAS at the Universidad de La Plata and World Bank. See http://sedlac.econo.unlp.edu.ar/eng/
Statistics South Africa (2014). Poverty Trends in South Africa: An Examination of Absolute Poverty between 2006 and 2011, Pretoria.
[1] The Gini coefficient compares the distribution of income in a population to a scenario where there is perfect equality. The measure falls between zero and one, where the former describes perfect equality and the latter is perfect inequality. South Africa’s Gini value is one of the highest in the world (StatsSA 2014:13).
[2] Other data sources are the 2008 National Income Dynamics Study (NIDS) and some administrative data.
[3] VAT revenue constitutes about a quarter of government’s total tax revenue, compared to about 3.5% for excise taxes and 5.2% for the fuel levy.
[4] For the scenario where free basic services are perfectly targeted to help the poor, progressivity is measured by dividing the total amount of the budget for basic services equally amongst the poor that actually receive municipal services and then comparing the distribution of allocations to market income. For the scenario where targeting is not possible, the budget allocation for free basic services is divided amongst the entire population that receive municipal services and the distribution of the transfer is then compared to market income.
Download article
Post a commentary
This comment facility is intended for considered commentaries to stimulate substantive debate. Comments may be screened by an editor before they appear online. To comment one must be registered and logged in.
This comment facility is intended for considered commentaries to stimulate substantive debate. Comments may be screened by an editor before they appear online. Please view "Submitting a commentary" for more information.