Soaring deficits and debt II: Budget 2020 and a looming debt trap?
Introduction
In Burger & Calitz (2020), published on Econ3x3 prior to the 2020 budget speech, we demonstrated that stabilising the public-debt-to-GDP ratio would require a cut in the overall budget deficit of 2% to 3% of GDP (assuming GDP growth rebounded to between 2% and 2.5%). We argued for a phased-in approach over the medium term, i.e. up to fiscal year (FY) 2023, i.e. 2022/23.[1]
This is not what Minister Mboweni proposed in his budget speech. Instead, notwithstanding a budgeted cut of R160 billion in the increase in the wage bill of government,[2] the Minister is budgeting for an increase in the overall budget deficit to 6.8% of GDP in FY2021, declining somewhat to 5.7% in FY 2023 (Table 9, 2020 Budget Review). As figure 1 shows, the gross public debt-to-GDP ratio is projected to increase from 61.6% in FY2020 to 71.6% in FY2023. In FY2017 it was still at 50%.[3] The projected slight decline in the deficit (as a percentage of GDP) will turn into an increase should the government accede to labour union pressure to not reduce the planned salary increases.
Figure 1. The public debt-to-GDP ratio:
actual (FY1987-2019) and budgeted (FY2020-2023)
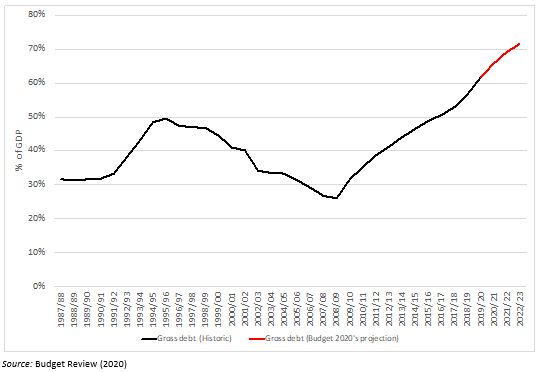
These developments raise the question whether or not the South African government already finds itself in a debt trap. And if not, what can be done to escape what might be a looming debt trap?
Is there a cut in budgeted government expenditure?
Post-budget commentaries focused largely on the planned cut of R160 billion in the projected increase in the government’s wage bill (respectively reducing it by R38 billion in FY2021, R55 billion in FY2022 and R67 billion in FY2023[4]). Reducing the increase in the government wage bill by R67 billion by FY2022 is indeed significant. However, several commentators have questioned government’s willingness, or ability, to go head-to-head with labour unions to ensure that this ‘cut’ is realised.
Importantly, this is not a net cut in government expenditure. From FY2021 to FY2023 total consolidated government expenditure is still projected to increase by R302 billion over the three years (i.e. even if the trimmed increase in the salary bill is achieved). Consequently, over this period the overall deficit is budgeted to decline by only R23 billion. As a percentage of GDP it is still budgeted to be at a very high 6.8% in FY2021, declining to only 5.7% in FY2023 (see figure 3 below).
The 1.1 percentage-point decrease in the deficit ratio (from 6.8% to 5.7%) is a far cry from the 3 percentage-point reduction needed to stabilise the debt-to-GDP ratio. The outcome may be even worse should economic growth be below the Treasury’s projections.
Making a move or not – watching the primary budget balance
The increase in the public debt-to-GDP ratio from 61.6% in FY2020 to 71.7% in FY2023 mirror the projected primary budget deficits of 2.4%, 1.5% and 0.8% of GDP for consolidated government in these three fiscal years. (The primary budget balance is the difference between total government revenue and the non-interest expenditure of government; see Burger & Calitz, Econ3x3). As long as the government runs a primary deficit in an environment where the real interest rate on government debt exceeds the real economic growth rate, as is the case at present, the debt-to-GDP ratio will continue increasing. Therefore, unless the primary deficit of 0.8% in FY2023 swings into a primary surplus of 1.6% in the following year (a swing of 2.4% of GDP), the debt-to-GDP ratio is set to continue increasing after FY2023.
Figure 2 shows a number of possible scenarios that can play out following the 2020 budget. The starkest projection (the grey line in Figure 2) represents a failure on the part of the government to reduce the 2.6% primary deficit in an environment where the real economic growth rate remains stuck at 0.5%. In that scenario the debt-to-GDP ratio will breach 100% by as soon as FY2027. Such a scenario may materialise if the government only partially implements the R160 billion slowdown in the rate at which the wage bill increases over the medium term. Failure to stabilise the debt-to-GDP ratio – i.e. failure to restore fiscal sustainability – would, in turn, also undermine investor and business confidence, and thus, the GDP growth rate.
The second scenario (the red line) represents, more or less, the trajectory since FY2013. It assumes that the economic growth rate slowly improves to about 2% by FY2025 and the primary deficit falls to 1.5%, which is its average for the period since FY2013. This scenario is fiscally unsustainable as well, with the public debt-to-GDP ratio still set to increase sharply, reaching 100% by FY2031.
Figure 2. Public debt scenarios

Scenarios three and four incorporate governmental failure to restore fiscal sustainability by FY2023, but nevertheless assumes a gradual move thereafter to a condition of fiscal sustainability. In the third scenario (the yellow line) the government slowly moves from a primary deficit currently to a zero primary balance by FY2026 and a primary surplus of 1.6% by FY2029. This scenario also assumes that economic growth improves to 2% by FY2025. The debt-to-GDP ratio stabilises at 81% by FY2027. The fourth scenario (green line) assumes that GDP growth improves to 2.5% by FY2025, enabling a smaller adjustment in the primary surplus, to 1.1% of GDP. This scenario stabilises the debt-to-GDP ratio at 77% by FY2025.
Note that both scenarios three and four stabilise the debt-to-GDP ratio at very high levels that leave little, if any, room for the government to implement counter-cyclical policy in the event of an economic downturn. A shock to GDP such as the 2008 global financial crisis (or possibly the 2020 Covid-19 crisis) could easily cause the debt-to-GDP ratio to spiral out of control and resume its upward path.
What will it take to reduce the debt-to-GDP ratio to the 50% ratio of only four years ago, in FY2017? To assess this, assume that economic growth reaches 2.7% by 2025, which is its average for 1994 to 2019 (but significantly more than the 1.7% over the last decade). A first step would be to improve the primary balance to a surplus of 0.5% in FY2025, and thereafter by 0.5% of GDP per year until it reaches 3.5% in FY2029. Maintaining it at 3.5% after that would reduce the debt-to-GDP ratio to 50% only by FY2037 (the blue line in figure 2).
This last scenario impresses the difficulty, if not impossibility, of restoring the debt-to-GDP ratio to a level it had only four years ago, in FY2017. Not only is a primary surplus of 3.5% of GDP very high, but moving from a 2.5% primary deficit to a 3.5% primary surplus will amount to a 6%-of-GDP improvement in the primary balance. A 6%-of-GDP change will clearly present an enormous challenge and is in all likelihood politically impossible to achieve. Thus, in all likelihood, in the absence of substantially higher economic growth rate the country will remain stuck with a high debt-to-GDP ratio over the long run.
We are paying a high price, which might endure at least for a decade or two, for the cumulative deficit and debt consequences of the expenditure decisions and economic policy mismanagement of the past decade.
Where to cut the deficit? Revenue and expenditure levels and trends
It seems that even in the best of circumstances the debt-to-GDP ratio is likely to breach 75% or even reach 80% by FY2026. That is high for an emerging-market country. The 2020 budget does not convince us that government is in fact planning to reverse this in the foreseeable future (at least until FY2023).
This leaves two ways to approach the issue. The first is to agitate for an urgent revision of the FY2022 and FY2023 fiscal frameworks (since the 2020 budget is a done deal once parliament approves it). The second, given the slow-moving political machinery as well as fragile and fragmented political ties in the tripartite alliance, is to assume that the expenditure and budgetary framework for the period FY2021 to FY2023 is a given. This implies that adjustments can only be made over the longer term (after FY2023), once the political machinery has come around to accepting the required adjustments – were this to happen. We focus on the second approach. (Any revision in the interim, i.e. in FY2022 and FY2023, will be a bonus that improves whatever outcome we present below.)
The overall budget balance is merely the difference between total government revenue and expenditure. The blue and green lines in figure 3 show the course of these two variables since FY2011. It also includes the recent budget’s projections for government expenditure and revenue for FY2021 to FY2023.
Clearly visible is the large gap between expenditure and revenue (the gap between the blue and green lines), which is the overall deficit (grey and red bars). The gap became wider in FY2020, with a deficit of 6.3% of GDP, and is projected to bulge to 6.8% in FY2021, before narrowing to 5.7% in FY2023.
Figure 3. Government expenditure and revenue (consolidated government)
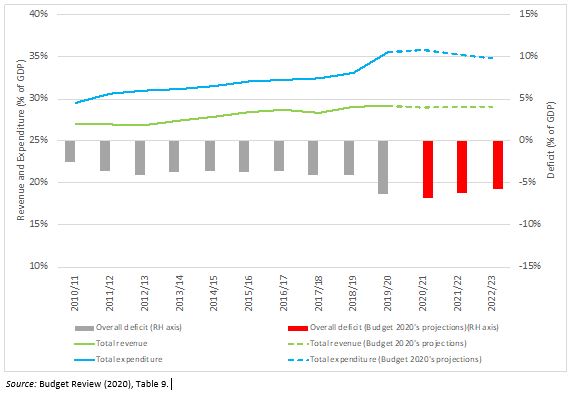
What is also notable in figure 3 is that expenditure, as a percentage of GDP, has increased much faster than revenue. From FY2011 to FY2020 the total expenditure-to-GDP ratio has increased by 5.9 percentage points, but revenue grew only by 2.2 percentage points of GDP. In addition, the slow growth in revenue occurred despite increases in both the personal income tax and value-added tax rates in recent years. This suggests that increasing tax rates further is not a solution to stabilise the debt-to-GDP ratio.
Indeed, South Africa is highly taxed for an emerging market. Only five emerging economies carry heavier burdens (Brazil, Cyprus, Tonga, Malta and the Seychelles), with 20 emerging markets collecting less revenue than South Africa as a percentage of GDP. These include China, Thailand, Indonesia, Kenya and Uganda. South Africa also has a higher total revenue-to-GDP ratio than the US, Switzerland, South Korea, Australia and Israel, all of which are developed economies.[5] Given South Africa’s relatively high revenue burden compared to other emerging market economies, increasing tax rates will discourage investment, productivity and innovation.
With tax rate increases not an option, only three ways (which could be combined) remain to stabilise the debt-to-GDP ratio and to reduce the deficit after FY2023:
- Reduce the tax gap, i.e. the difference between what government can collect if all taxes are paid and what is actually collected. The tax gap comprises a policy gap (due to tax allowances, which may be revised or terminated) and the compliance gap, which stems from tax evasion – a major focus of the South African Revenue Service (SARS) at present.
- Ensure that the type of expenditure that government undertakes supports economic growth, thereby increasing the growth rate of the denominator of the debt-to-GDP ratio. This includes a shift from current to capital expenditure as well as an improvement in service delivery (thus ensuring that the government – and the taxpayer – gets more bang for the buck).
- The most important step, given the scale of the problem, is to cut expenditure. The analysis above shows that in the two debt-stabilisation scenarios (numbers three and four) the primary balance needs to improve by between 3% and 4% of GDP by FY2027.[6] In 2020 rands this entails a permanent cut in total expenditure of between R165 billion and R220 billion a year.
There is not much room to cut the gross capital expenditure of government. At R163 billion it is already at a low 3% of GDP. In fact, the required adjustment in expenditure exceeds the total capital budget.
This leaves, as the only options to cut expenditure, to reduce the government wage bill and the goods and services budget, respectively at R639 billion and R265 billion in the 2020 budget (see Table 9 in the Budget Review). (Of course, reducing the deficit and stabilising the debt-to-GDP ratio will eventually also reduce the interest paid by government.)
An expenditure cut of between R165 billion and R220 billion would constitute between 18% and 24% of the combined salary and goods-and-services bills. This is the reality we need to face.
Such large cuts will have to be phased in over time. For the salary bill, this can be realised through natural staff attrition due to retirements and resignations, reducing staff numbers in overstaffed programmes and departments, and keeping individual salary growth rates below inflation. (Cutting the total wage bill does not preclude salary increases for productive and high-performing government employees, as long as the total wage bill decreases.)
The goods and services bill can be right-sized by, among other things, eliminating corrupt and overpriced contracts, eliminating waste and prioritising procurement better.
Conclusion: Escaping the debt trap?
Although the 2020 budget plans to cut R160 billion from the projected salary bill increase over three years, it does not stop real expenditure growth and does not arrest the ballooning of the debt-to-GDP ratio. The government is unlikely to prevent the debt-to-GDP ratio from breaching 75% or even 80% by FY2026.
Merely stabilising the debt-to-GDP ratio at such a high level will require strong cutbacks of 3% to 4% of GDP in especially the salary bill and the goods and services bill from at least FY2023 onwards.
Unfortunately, the cut in the primary balance that would be necessary to reduce the debt-to-GDP ratio to 50%, even if spread over two decades, is in all likelihood not politically feasible. This is so even if economic growth were to return to its longer-run average of 2.7% by FY2026.
Unless South Africa again experiences a high-growth episode such as the one of 2003-2008, it is unlikely to return to debt-to-GDP ratios of below 50% or even 60%. A persistent high debt-to-GDP ratio means that in the long run the government’s financial position will remain precarious, leaving little room for counter-cyclical policy. Higher growth episodes clearly are what is needed, but these depend on many things other than fiscal policy.
What is also required is an absolute insistence on actually achieving higher levels of effectiveness and efficiency in government departments at all levels, since that can make a major contribution to getting economic growth going again. A shift from current to capital expenditure is needed furthermore.
Whether the South African government is heading for a debt trap depends on whether the government will be able to serve the national interest and not yield to the demands of labour unions to not cut the government wage bill. Ultimately, there is no substitute for political will, leadership and agreement, both on the part of government and the trade unions, to avoid a debt trap.
References
Burger P & Calitz E. 2019. Sustainable fiscal policy and economic growth in South Africa. Stellenbosch Working Paper Series No. WP15/2019.
Burger P & Calitz E. 2020. Soaring deficits and debt: restoring sustainability amidst low economic growth. Econ3x3 February 2020.
National Treasury 2020. Budget Review. Pretoria.
[1] A fiscal year runs over two calendar years. For example, fiscal year 2022/23, also indicated as FY2023, begins on 1 April 2022 and ends on 31 March 2023. ‘Budget 2020’ and ‘the 2020 budget’ refer to the budget submitted in 2020 for FY2021. When a date is not preceded by FY, it refers to a calendar year.
[2] Note that it is a cut in the projected increase in the wage bill. The government projected an increase in the wage bill in 2019, then in the 2020 budget it reduced that increase by R160 billion over the medium term (which is merely the sum of the reductions in each of the three years). This still leaves the wage bill for consolidated government increasing by R67.9 billion between FY2020 and FY2021. However, with inflation expected at 4.5% in FY2020, the rate of increase is projected to be lower than inflation at 1.5% in FY2020, and almost equal to inflation at 4.5% in FY2022 and 4.4% in FY2023 (inflation is projected at 4.6% in both years).
[3] This is the debt of national government, and therefore excludes borrowing by local authorities and state-owned enterprises (SOEs). Since provinces cannot sell bonds, national debt is also the debt of consolidated government, defined as national and provincial government, social security funds and selected public entities, including transfers and subsidies to municipalities, businesses and other entities. Note that guarantees by national government of SOE debt has the potential to cause national government debt to increase even further, that is, in the event that SOEs default on any or all of their debt obligations. Such guarantees are approximately 10% of GDP, the most notable of which is Eskom debt.
[4] The R160 billion is the sum of cuts over three years – thus, the total cut in the projected increase in the salary bill in FY2023 is just R67 billion, not R160 billion.
[5] IMF data show that when considering the aggregate of tax revenue (at 28.5% of GDP), social security and other revenues (such as user fees) collected on general government level, the claim of government on resources in South Africa amounts to 37.5% of GDP. This places South Africa in 33rd place out of 80 high income and emerging economies, and 6th place among just emerging economies. Top of the list are the Scandinavian countries, France and Belgium with total revenue-to-GDP ratios in excess of 50%. All these countries have large social security systems, with tax bases, public expenditure demands and standards of public service delivery markedly different from that of South Africa.
[6] This is higher than the cut we suggested in the previous Econ3X3 article because the scenario in this article only commences after four more years.
Download article
Post a commentary
This comment facility is intended for considered commentaries to stimulate substantive debate. Comments may be screened by an editor before they appear online. To comment one must be registered and logged in.
This comment facility is intended for considered commentaries to stimulate substantive debate. Comments may be screened by an editor before they appear online. Please view "Submitting a commentary" for more information.